x




Key Points
Bitcoin price traded to a new yearly low at $3,126 and later corrected a few points against the US Dollar.
There was a break above a key bearish trend line with resistance at $3,220 on the 4-hours chart of the BTC/USD pair (data feed from Kraken).
The pair may perhaps correct higher in the short term towards the $3,320 or $3,380 resistance.
Bitcoin price is forming a short term base near $3,120 against the US Dollar. BTC/USD is likely to test the $3,380-3,400 resistance zone before declining once again.
Bitcoin Price Analysis
This past week, bitcoin price remained in a slow and steady downtrend from the $3,640 high against the US Dollar. The BTC/USD pair traded lower and broke the $3,400 and $3,320 support levels. The decline gained pace and the price traded to a new yearly low at $3,126. Later, it consolidated above $3,126 for a few sessions before correcting higher. It moved above the $3,200 resistance, but it is well below the 100 simple moving average (4-hours).
During the rise, it almost broke the 23.6% Fib retracement level of the last slide from the $3,642 high to $3,126 low. Moreover, there was a break above a key bearish trend line with resistance at $3,220 on the 4-hours chart of the BTC/USD pair. However, it seems like buyers are struggling to gain pace above the $3,250 level. The first hurdle for buyers is near the $3,320 level (the previous support). The next is $3,380 and the 50% Fib retracement level of the last slide from the $3,642 high to $3,126 low. A successful break above $3,380 and the $3,400 is needed for buyers to gain bullish momentum.
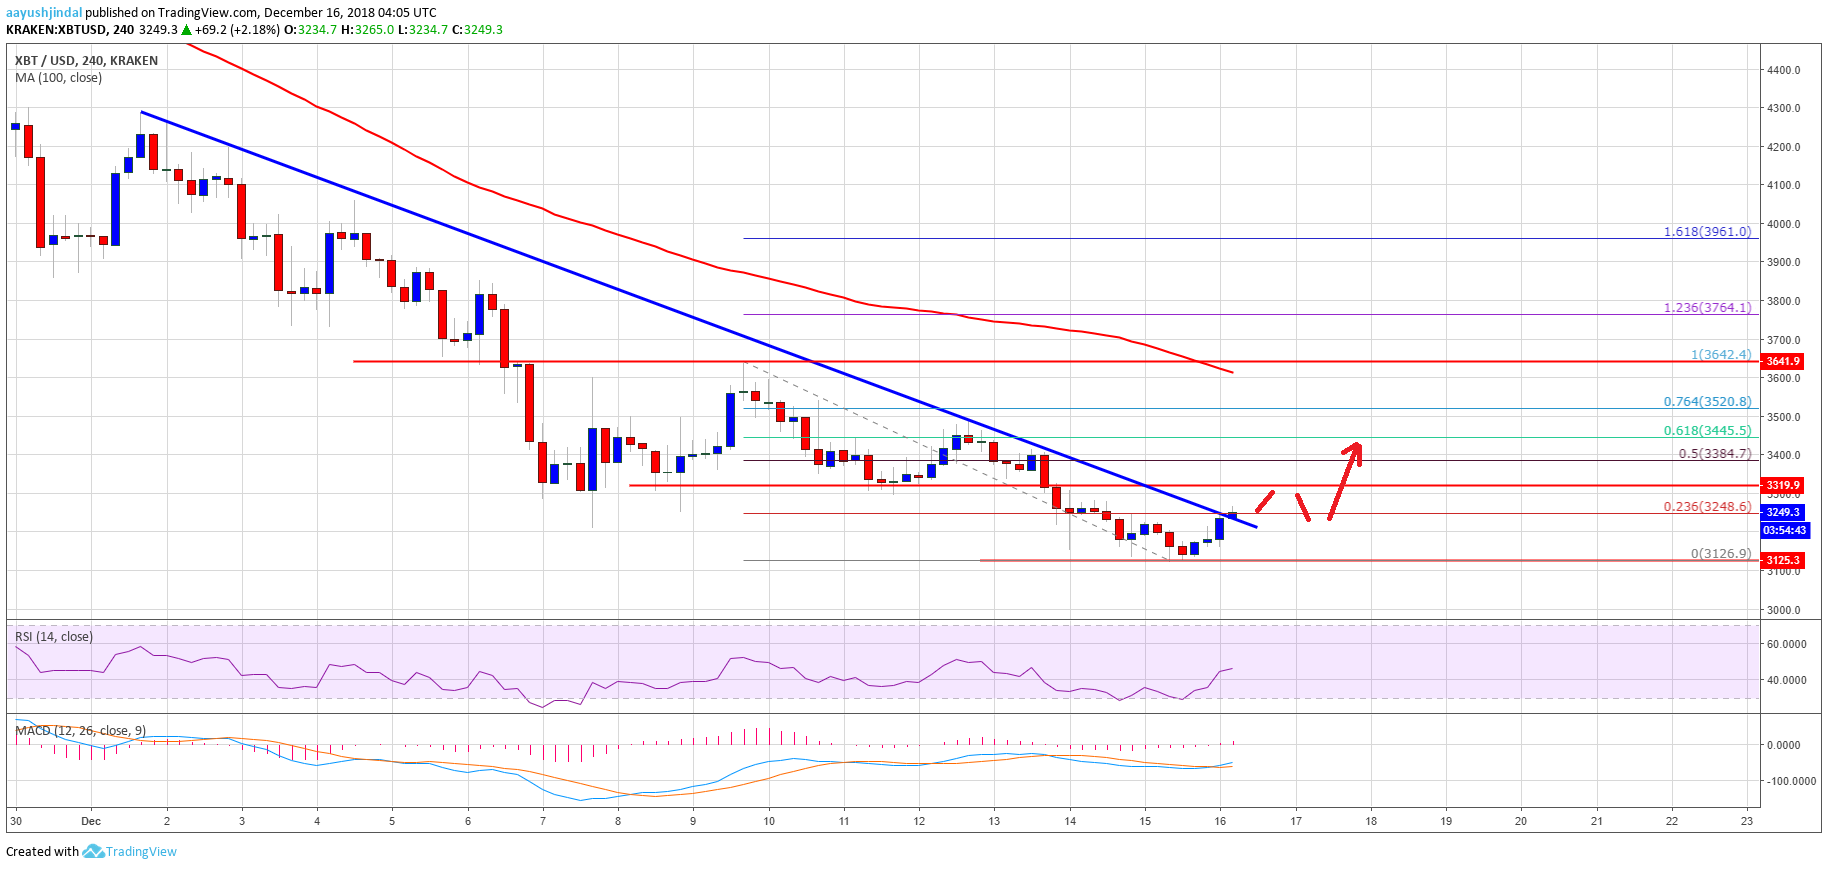
Looking at the chart, BTC price could correct higher towards $3,380, but more upsides won’t be easy. On the downside, the $3,200 and $3,126 levels are decent supports, followed by $3,000.
Looking at the technical indicators:
4-hours MACD – The MACD for BTC/USD is slowly moving in the bullish zone.
4-hours RSI (Relative Strength Index) – The RSI is just near the 50 level.
Major Support Level – $3,200
Major Resistance Level – $3,400
AAYUSH JINDAL | DECEMBER 16, 2018 | 5:00 AM