x





Bitcoin price is surging higher towards $20,000 against the US Dollar. BTC/USD might soon break the $20k level and gain further traction in the near term.
Key Points
Bitcoin price is gaining pace once again and is currently trading above $18,000 against the US Dollar.
There is a monster bullish trend line forming with support at $17,000 on the 4-hours chart of BTC/USD (data feed from SimpleFX).
The pair is moving higher and it might soon break the $20,000 level for more gains in the near term.
Bitcoin price is surging higher towards $20,000 against the US Dollar. BTC/USD might soon break the $20k level and gain further traction in the near term.
Bitcoin Price Trend
There were nasty gains in bitcoin price above the $16,000 level against the US Dollar. After a major correction, the price found support above $15,000. Later, buyers gained momentum and were able to push the price above the $17,000 level. It opened the doors for more gains and the price was able to trade to a new all-time high above $19,000. The recent high was $19,426 and it seems like the current upside move is far from over.
During the upside move, the price was able to break a major connecting resistance trend line at $18,000 on the hourly chart. The current price action is positive above $17k and it seems like the price might continue to move higher. On the downside, an initial support is around the 23.6% Fib retracement level of the last wave from the $15,590 low to $19,426 high. Moreover, the broken trend line at $18K could act as a strong support in the near term.
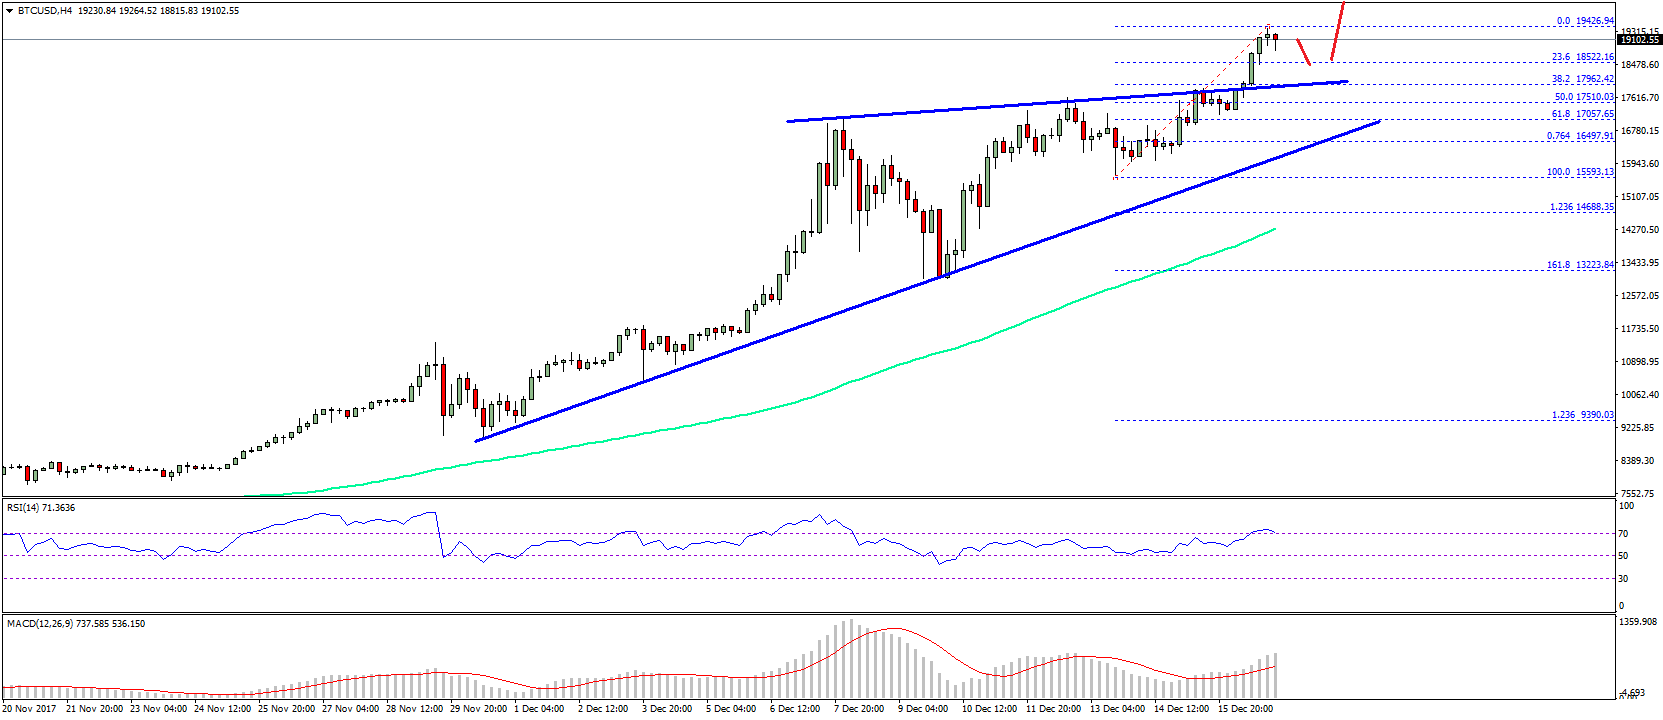
Moreover, there is a monster bullish trend line forming with support at $17,000 on the 4-hours chart of BTC/USD. Therefore, the current trend is very positive and the pair might accelerate above $20K in the near term.
Looking at the technical indicators:
4-hours MACD – The MACD is gaining momentum in the bullish zone.
4-hours RSI (Relative Strength Index) – The RSI is reaching the overbought levels, but with no signs of a major correction.
Major Support Level – $17,000
Major Resistance Level – $20,000
Author: Aayush Jindal 6:00 am December 17, 2017
Posted by David Ogden Entrepreneur