x




Key Points
Bitcoin price declined recently towards the $3,560 support area against the US Dollar.
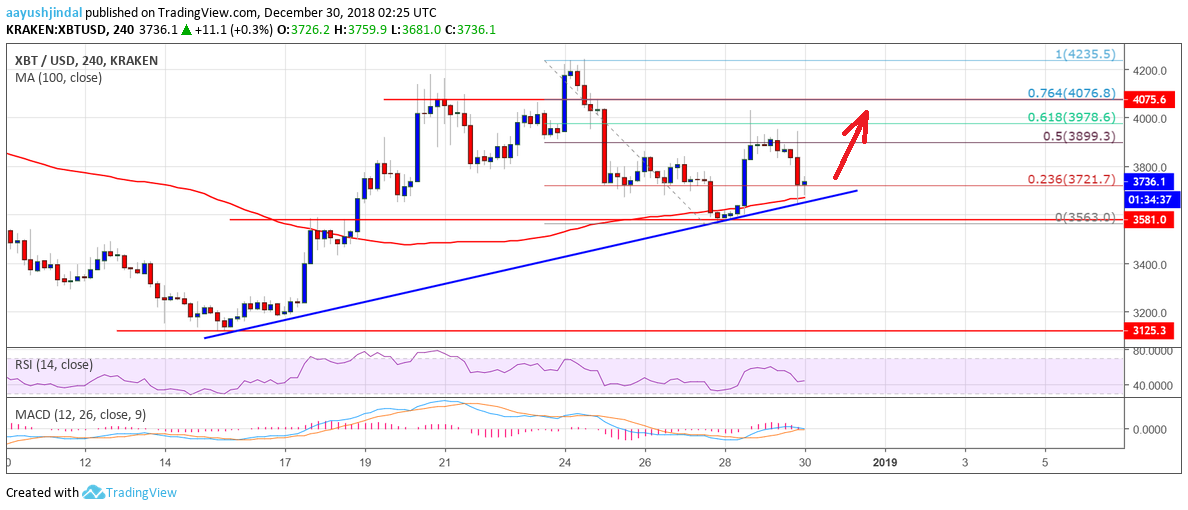
There is a key bullish trend line formed with support $3,680 on the 4-hours chart of the BTC/USD pair (data feed from Kraken).
The pair is currently holding a crucial support and it could bounce back above $3,800 and $3,900.
Bitcoin price is holding the key uptrend support near $3,600 against the US Dollar. BTC/USD is likely to resume its upward move above $4,000 in the near term.
Bitcoin Price Analysis
This past week, bitcoin price started a major downside move from the $4,235 level against the US Dollar. The BTC/USD pair traded below the $4,000 and $3,800 support levels. However, the price found support near the $3,550 level and later started an upward move. More importantly, the price stayed above the $3,500 pivot level and the 100 simple moving average (4-hours).
The price jumped above $3,800 and the 50% Fib retracement level of the recent decline from the $4,235 high to $3,563 low. However, the price failed to clear the $3,980 and $4,000 resistance area. Besides, the 61.8% Fib retracement level of the recent decline from the $4,235 high to $3,563 low also acted as a resistance. There was yet another downside move, but the $3,675 level acted as a support. Finally, there is a key bullish trend line formed with support $3,680 on the 4-hours chart of the BTC/USD pair. If there is a break below the trend line, the price decline towards $3,550 or $3,500.
Looking at the chart, BTC price seems to trading above important support levels near $3,600. On the upside, buyers need to clear the $3,900 and $4,000 resistance levels for more gains. The next major resistance is near the $4,080 and $4,200 levels.
Looking at the technical indicators:
4-hours MACD – The MACD for BTC/USD is likely to move back into the bearish zone.
4-hours RSI (Relative Strength Index) – The RSI is currently below the 50 level.
Major Support Level – $3,550
Major Resistance Level – $4,000
AAYUSH JINDAL | DECEMBER 30, 2018 | 5:00 AM