x





Key Points
Bitcoin price fell significantly and traded below $4,000 and $3,800 against the US Dollar.
There is a major bearish trend line formed with resistance at $4,200 on the 4-hours chart of the BTC/USD pair (data feed from Kraken).
The pair is under pressure below $3,800 and it could even break the $3,500 support level.
Bitcoin price tumbled more than 15% and broke the $3,800 support against the US Dollar. BTC/USD could accelerate declines towards the $3,500 level.
Bitcoin Price Analysis
This past week, there was a tiny upside correction above the $4,300 level in bitcoin price against the US Dollar. However, the BTC/USD pair failed to gain traction above the $4,400 and $4,500 resistances. As a result, there was a sharp downside move and the price declined below the $4,000 support. The price declined more than 12% and it is currently trading well below $3,800 and 100 simple moving average (4-hours).
A new yearly low was formed at $3,620 and it seems like the current decline is not over. The last swing low was at $3,678 before the price started an upside correction. It moved above the 23.6% Fib retracement level of the recent decline from the $4,340 high to $3,678 low. However, the upside move was capped by the $4,000 level. The price was also rejected near the 50% Fib retracement level of the recent decline from the $4,340 high to $3,678 low. Finally, the price declined again and broke the $3,678 swing low. A new low was formed below $3,650 and it seems like there could be more losses. The next key support is near $3,500, below which the price could test $3,200.
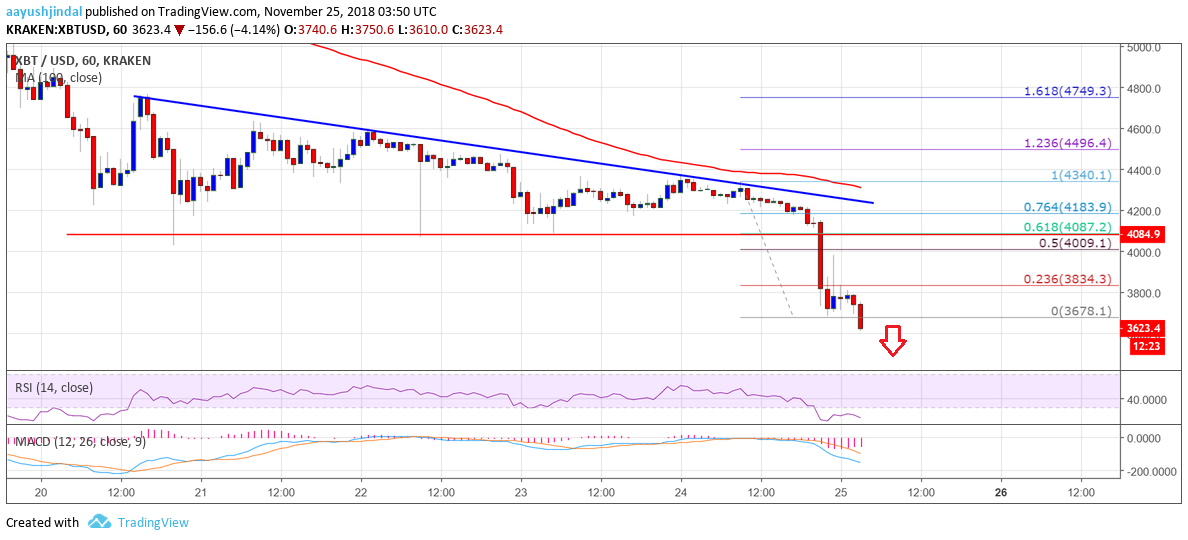
Looking at the chart, BTC price is facing a lot of selling pressure below the $4,000 and $3,800 level. If there is an upside correction, the price could face sellers near $4,000.
Looking at the technical indicators:
4-hours MACD – The MACD for BTC/USD is placed heavily in the bearish zone.
4-hours RSI (Relative Strength Index) – The RSI is currently well below the 20 level.
Major Support Level – $3,500
Major Resistance Level – $4,000
AAYUSH JINDAL | NOVEMBER 25, 2018 | 5:28 AM