x


Key Points
Bitcoin price is currently consolidating around the $6,500 level against the US Dollar.
The BTC/USD pair is currently attempting an upside break above a declining channel with resistance at $6,500 on the 4-hours chart (data feed from Kraken).
The pair may move a few points higher, but there are many hurdles on the upside near the $6,800 level.
Bitcoin price is stable above the $6,400 level against the US Dollar. BTC/USD must gain momentum above $6,600 and $6,800 to move into a bullish zone.
Bitcoin Price Resistance
This past week, bitcoin price started an upside correction after dropping to the $6,130 level against the US Dollar. The BTC/USD pair moved above the $6,200 and $6,400 resistance levels. There was also a break above the 23.6% Fib retracement level of the last downside move from the $7,785 high to $6,130 swing low. However, the price faced a lot of sellers around the $6,700 level.
There was a rejection from a declining channel with current resistance at $6,500 on the 4-hours chart of the BTC/USD pair. Moreover, the 38.2% Fib retracement level of the last downside move from the $7,785 high to $6,130 swing low acted as a hurdle. The price moved down below $6,600 but found support. It is currently moving higher once again and is attempting a break above the same channel and $6,500. Should the price succeed in moving past the channel resistance, it could move higher towards the $6,600 and $6,700 resistance levels. Above this last, the next hurdle sits around the $6,800 level.
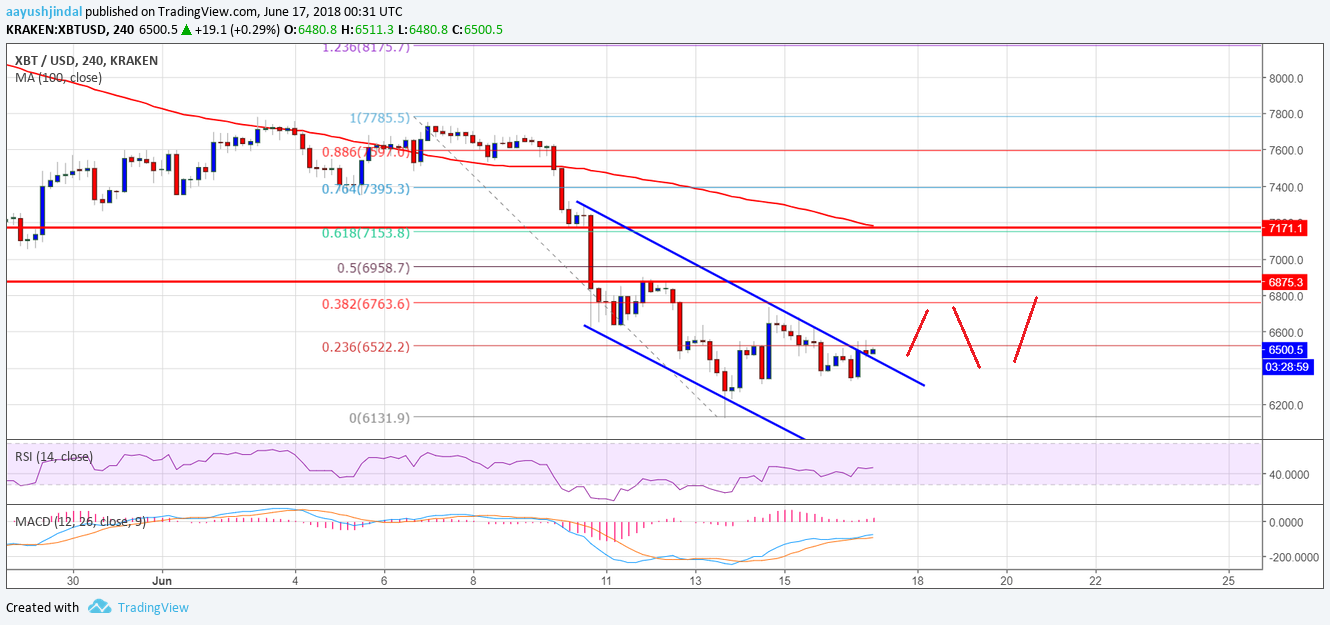
Looking at the chart, the current price action suggests consolidation above the $6,400 level. A break above the $6,700 level may perhaps open the doors for an upside push towards $7,000.
Looking at the technical indicators:
4-hours MACD – The MACD for BTC/USD is currently flat in the bullish zone.
4-hours RSI (Relative Strength Index) – The RSI is just around the 50 level.
Major Support Level – $6,400
Major Resistance Level – $6,700
Author AAYUSH JINDAL | JUNE 17, 2018 | 4:48 AM