x



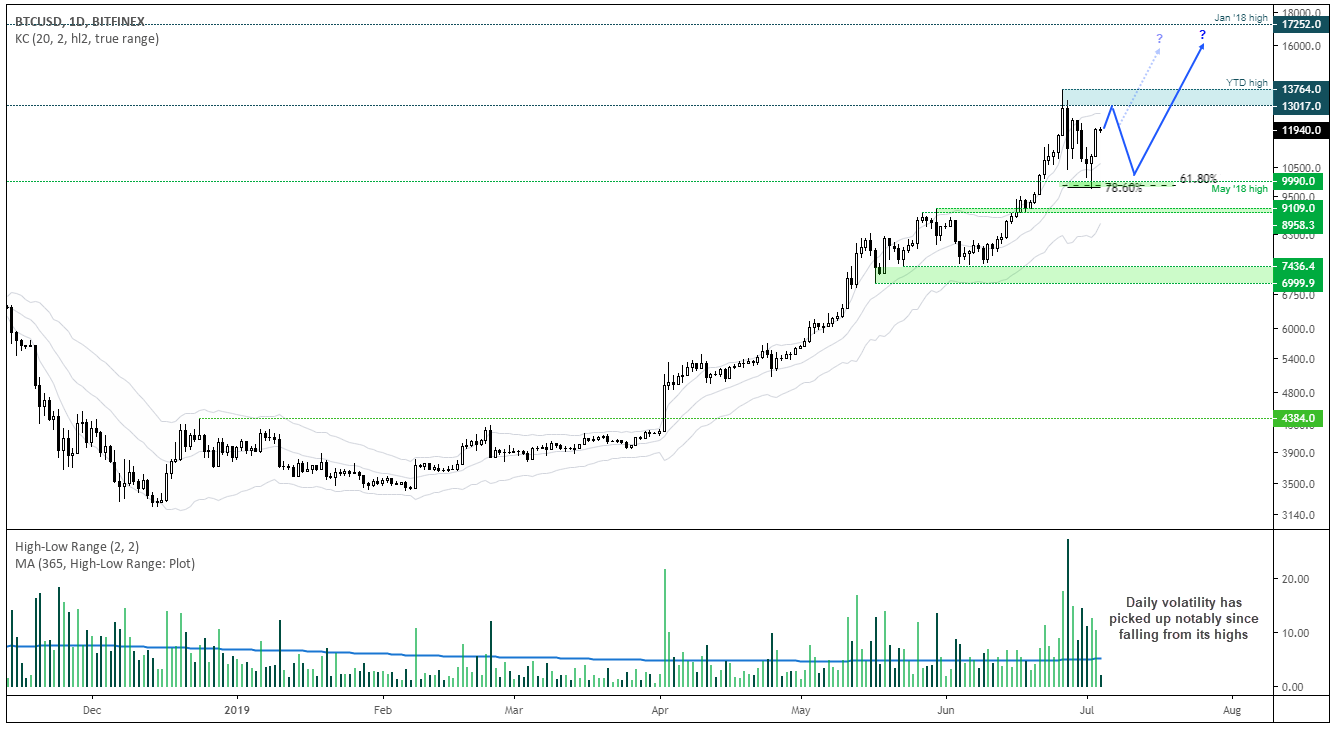
Whilst volatility is generally expected to be lower on US Independence Day today, Bitcoin clearly has other plans after rallying 10% just after US markets closed. Let’s take a close look at this volatility.
On the face of it, the daily chart appears constructively bullish. It continues to print higher highs and lows, a 3-wave (corrective) move is apparent on the four-hour chart and a spinning top Doji and bullish appeared near its corrective lows. Furthermore, the bullish hammer respected a 78.6% Fibonacci extension, before rallying higher. If prices can build a level of support above 10, then we could indeed see this breaking higher. However, the levels of volatility seen near its record highs are a concern, so we’re on guard for another, volatile dip lower if it fails to break above its cycle highs.
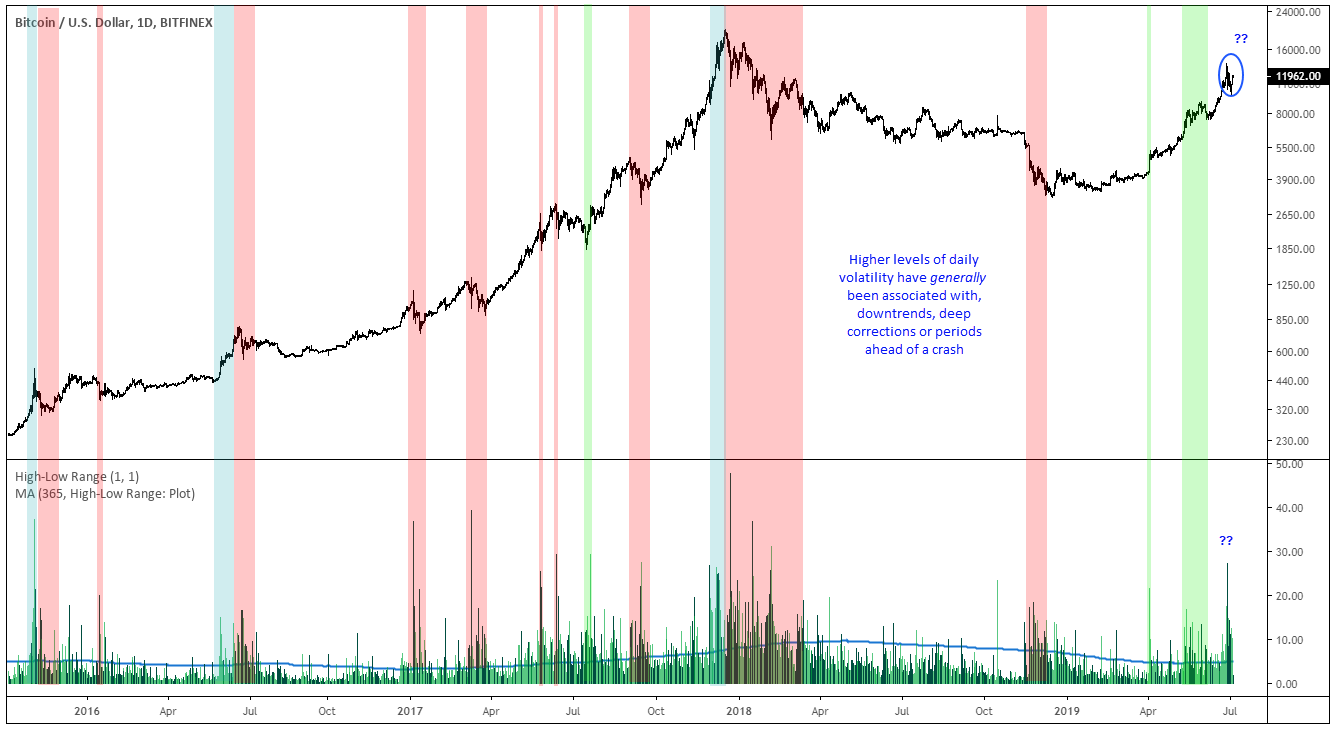
As previously mentioned, volatility on Bitcoin is a different beast, but even by its own standards it appears erratic after hitting new highs.
Bitcoin gave back nearly 30% after hitting its new high over 6 sessions, making it the largest correction during this uptrend. This compares with an 18% decline over 7 sessions in its previous correction.
27% of this fall was the day after the high.
8 sessions of the last 7 has seen daily ranges above 10% (the 1-year rolling average is 5.2%).
Flicking back through the chart, these levels of volatility have generally been associated with, downtrends, deep corrections or periods ahead of a crash. Therefore, whilst we shouldn’t necessarily ‘fight the trend’ if it breaks higher,having an appreciation for price action characteristics could at least provide a reality check for our expectations.
By Matt Simpson,