x




Bitcoin settles at $7,000 after a strong weekend rally.
Critical support is seen at $6,500.
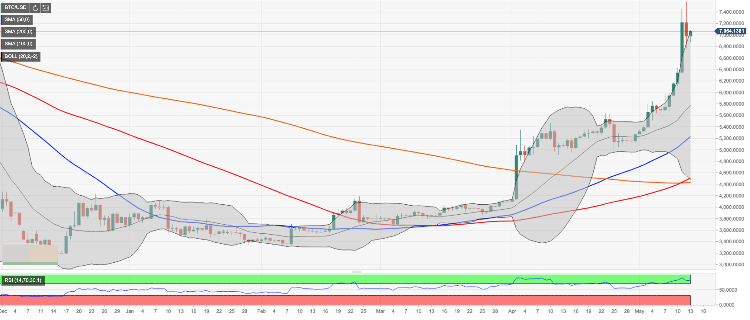
BTC/USD hit $7,582 on weekend. This is a new 2019 maximum and the highest level since September 2018. While the coin has retreated to $7,000 by the time of writing, the long-term trend remains strongly bullish with the next focus as high as $8,000.
Looking technically, BTC/USD broke above SMA200 on a weekly chart. The price moved above this technical barrier for the first time since November 2018. While this development can be interpreted as a bullish signal, traders should pay attention to some bearish signs - like weekly RSI reversed to the downside - that imply some short-term correction from an overbought territory. However, the bullish trend is intact as long as the price stays above $6,600-6,500 area supported by SMA200 weekly (currently at $6,590).
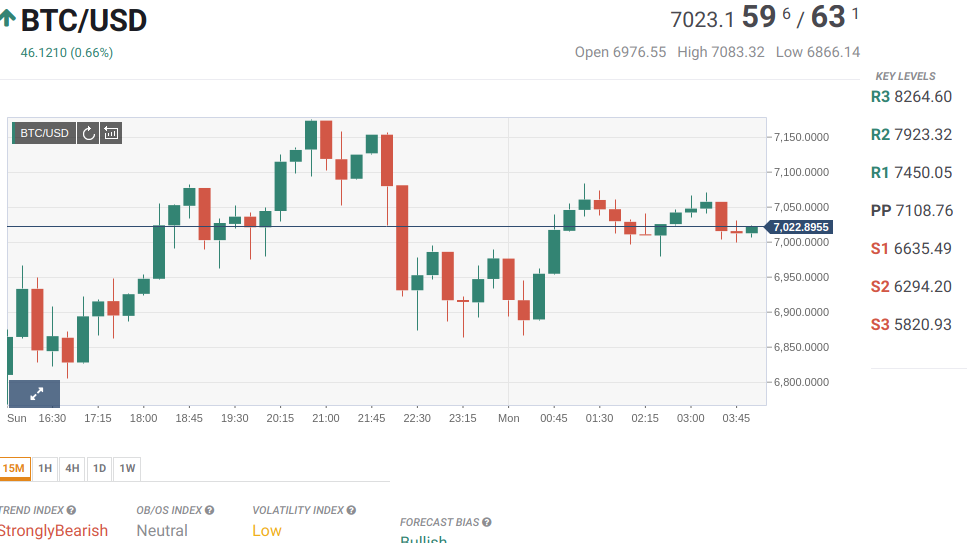
On the intraday charts, the local support comes at $6,750 (the middle line of 4-hour Bollinger Bands), once it is cleared the sell-off may be extended towards the above said $6,600 barrier and $6,200.
On the upside, we will need to see a sustainable move above $7,100 strengthened by the intraday low and the middle line of 1-hour Bollinger Band, for the recovery to gain traction. Ultimate resistance lies with $7,500 followed by he recent high of $7,582.
BTC/USD, 1-day chart
Tanya Abrosimova
FXStreet