x




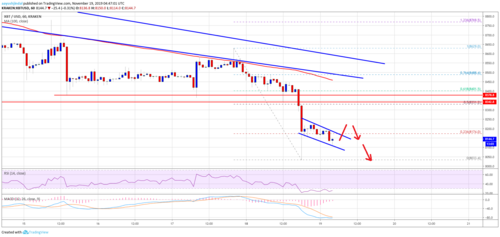
Bitcoin price is diving below the $8,340 and $8,200 support levels against the US Dollar.
The price is approaching the key $8,000 support area, where the bulls may take a stand.
There is a short term declining channel forming with resistance near $8,165 on the hourly chart of the BTC/USD pair (data feed from Kraken).
Both Ethereum and ripple are gaining bearish momentum below key supports.
Bitcoin price is declining towards the $8,000 support against the US Dollar. If BTC fails to stay above $8,000, the next stop could be near the $7,650 level.
Bitcoin Price Analysis
Yesterday, we discussed the chances of a breakdown in bitcoin towards the $8,200 support against the US Dollar. BTC did decline in the past three sessions and broke the $8,340 and $8,320 support levels.
Moreover, the price failed to stay above the key $8,200 support level and settled well below the 100 hourly simple moving average. It traded close to the $8,000 level and a new monthly low was formed near $8,033.
At the moment, the price is correcting higher above the $8,100 level. It is consolidating near the 23.6% Fib retracement level of the recent slide from the $8,630 swing high to $8,033 low.
On the upside, an immediate resistance is near the $8,180 and $8,200 levels. Besides, there is a short term declining channel forming with resistance near $8,165 on the hourly chart of the BTC/USD pair.
It bitcoin climbs above the channel resistance, it could test the $8,300 and $8,320 resistance levels. The previous major support near $8,320 is now likely to act as a crucial resistance for bitcoin. Additionally, the 50% Fib retracement level of the recent slide from the $8,630 swing high to $8,033 low is near the $8,330 level.
The main downtrend resistance is now near $8,450, $8,560, a couple of bearish trend lines, and the 100 hourly simple moving average. Therefore, a daily close above the $8,560 resistance is needed to start a decent recovery in the near term.
On the other hand, the price could continue to move down towards $8,000. Furthermore, if there is a downside break below the $8,000 support, the bulls are likely to give up. The next major support is seen near the $7,650 level.
.png)
Looking at the chart, bitcoin price is clearly trading in a strong downtrend below the $8,320 and $8,560 resistance levels. Thus, it remains a sell until there is a daily close above $8,560.
Technical indicators:
Hourly MACD – The MACD is losing pace in the bearish zone
Hourly RSI (Relative Strength Index) – The RSI for BTC/USD is currently moving in the oversold area.
Major Support Levels – $8,000 followed by $7,650.
Major Resistance Levels – $8,200, $8,320 and $8,450.
Aayush Jindal