x


Cautiousstill in the air as market prepares for the year-end
Overview
The prices of bitcoin initially stabilized near the 7500 levels after dipping into the 6500 area earlier this week. As we wrap up November, where will bitcoin prices go from here? While altcoins also have shown signs of recovery, what does that mean to the “Alt Season” believers?
Bitcoin: Short Term Cautiously Optimistic; Medium TermStill Cloudy
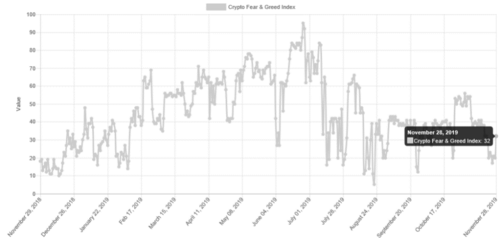
The prices of bitcoin have initially recovered from the November low of 6513, but the short-term and medium-term outlooks of the leading cryptocurrency could be two different pictures. On the short term front, preliminary data shows that market sentiment has turned slightly positive alongside the prices rebound. The Crypto Fear & Greed Index has jumped from 17 to 32 on September 28, suggesting market participants have eased certain of their worries as the price stabilized, although the reading is still considered at a “Fear” level.

Figure 1: Crypto Dear & Greed Index (Source: Alternative.me)
Technical-wise, we’ve also seen preliminary recovery signals, but the rebound could soon be tested again, and the coming days could be key to determine if that’s a true reversal or just a short-lived rally.
Figure 2a shows BTCUSDT has initially formed an uptrend on a 3-hour chart (red channel), the rebound hit the upper end of the channel, which is also near the major resistance line since late October (yellow line).
While both the ultimate oscillator and RSI have produced some higher highs, suggesting upside momentum has been building up. From here, two scenarios could happen. 1) The 3-hour chart could first find the bottom support of the latest uptrend before retest the October resistance, given that the pair must produce a higher low. 2) The pair consolidate at current levels until the momentum fades, if seen, the breaking of the lower end of the uptrend could be the first warning sign of further corrections. If we are going to begin to see a 3-hour upturn as is our bias, it would further support the likelihood of the first scenario.
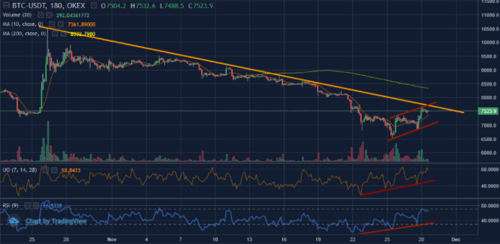
Figure 2a: BTCUSDT 3-Hour Chart (Source: OKEx; Tradingview)
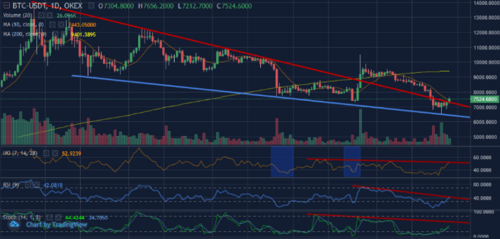
Figure 2b: BTCUSDT Daily Chart (Source: OKEx; Tradingview)
However, things would be less optimistic if we see it from the daily chart perspective. Figure 2b shows an initial daily reversal of BTCUSDT and the rebound has sent the price back above the June resistance levels (red line). We’ve seen the October rally have sent the price above the resistance levels; however, the pair has failed to turn it into support as the rally ran out of steam.
While the reversal, for now, is still too early to call a real trend reversal, we would like to see those momentum indicators to produce some higher highs, and so far, that has not happened. If the rally momentum fails to sustain, a retest of the blue support line could not be ruled out.
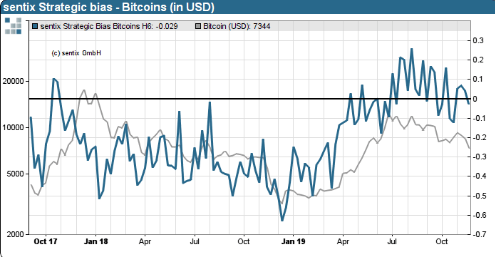
Figure 3: Sentix Bitcoin Strategic Bias (Source: Sentix)
From a longer-term perspective, data from Sentix suggests that some investors still believe that bitcoin remains overvalued. The Sentix Bitcoin Strategic Bias, which measures investors’ six-month perception value of bitcoin. It reflects the strategic view of market participants as well as their underlying convictions and perceptions of value for the cryptocurrency market. The Bias has been moving in a down channel since August. The negative perception could hinder investors to get into the market at this point, especially for long-term HODLers.
Alt-Season: Long Way to Go
While major altcoins have already off their recent lows, we are still very far away from a true start of an “Alt-Season”.
The broader altcoins have made its third attempt to breakout from the market cap downward channel in early November, at the same time, it tried to break above the 365-day moving average (orange line). As the rally momentum fades, altcoin has retreated into the channel in late November.
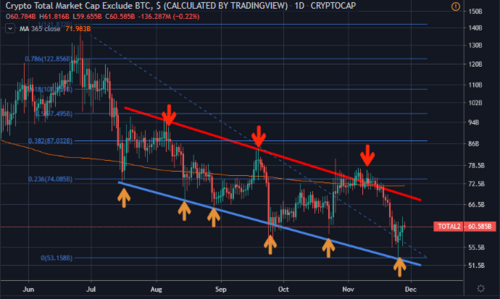
Figure 4: Crypto Total Market Cap Ex-BTC in Log Scale (Source: Tradingview)
The lower end of the channel (blue line) seems like decent support at this point. However, as the overall conservative sentiment lingers, in our view, we believe that more consolidation is needed for the altcoin market cap before the next breakout attempt happens. This chart could be a quick way to measure the broader altcoin market perceptions.
Cyrus Ip