x




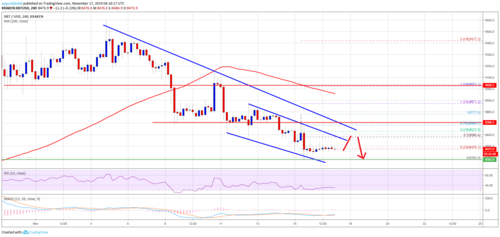
After settling below $9,000, bitcoin declined steadily against the US Dollar.
The price is under a lot of pressure below the $8,700 and $8,650 resistance levels.
There is a crucial bearish trend line forming with resistance near $8,630 on the 4-hours chart of the BTC/USD pair (data feed from Kraken).
Bitcoin price is trading in a bearish zone towards $8,200 against the US Dollar. BTC remains sell on rallies unless there is a successful close above the $8,880 resistance.
Bitcoin Price Weekly Analysis (BTC)
This past week, bitcoin saw an increase in selling pressure below the $8,880 support area against the US Dollar. Moreover, BTC price settled below the $8,700 pivot level and the 100 simple moving average (4-hours).
There were steady losses and the price broke the $8,600 and $8,500 support levels. A new monthly low is formed near $8,382 and the price is clearly trading in a bearish zone.
It is currently consolidating losses above the $8,400 level. Besides, bitcoin is trading near the 23.6% Fib retracement level of the recent decline from the $8,777 high to $8,382 low.
On the upside, there are many resistances near $8,580 and $8,600. There is also a declining channel forming with resistance near $8,580 on the 4-hours chart of the BTC/USD pair. Additionally, the 50% Fib retracement level of the recent decline from the $8,777 high to $8,382 low is also near the $8,580 level.
If there is an upside break above the channel resistance, the price could test the $8,620 and $8,630 resistance levels. More importantly, there is a crucial bearish trend line forming with resistance near $8,630 on the same chart.
To move into a positive zone, the price must break the $8,700 and $8,720 levels. Having said that, a proper close above the $8,880 resistance is needed for a trend change and a fresh increase.
On the downside, there are many key supports near the $8,320 and $8,200 levels. The bears are likely to face a strong buying interest near $8,200, below which there is a risk of a break down towards the $8,000 handle.
.png)
Looking at the chart, bitcoin price is following a bearish path, with key supports near $8,200. Therefore, there are chances of a short term upside correction towards the $8,600 and $8,700 levels. However, the upward move is likely to face sellers and gains could be capped by $8,880.
Technical indicators
4 hours MACD – The MACD for BTC/USD is slowly losing momentum in the bearish zone.
4 hours RSI (Relative Strength Index) – The RSI for BTC/USD is now recovering above the 30 level.
Major Support Level – $8,200
Major Resistance Level – $8,880
Aayush Jindal