x





Key Points
Bitcoin price struggled to gain traction above the $3,840 and $3,900 resistance levels against the US Dollar.
Yesterday’s highlighted major bearish trend line is intact with resistance at $3,720 on the hourly chart of the BTC/USD pair (data feed from Kraken).
The price is currently trading in a bearish zone and it could extend losses below $3,500.
Bitcoin price is under pressure below $3,800 against the US Dollar. BTC may correct a few points, but it remains sell on rallies near $3,720 and $3,800.
Bitcoin Price Analysis
There was an increase in selling pressure on bitcoin price after it failed to clear the $3,850 level against the US Dollar. The BTC/USD pair started a downside move and broke the $3,800 and $3,700 support levels. It even broke the $3,600 level and traded as low as $3,563. There could be a short term correction from $3,563, but the price is trading well below the 100 hourly simple moving average.
An initial resistance is near the 23.6% Fib retracement level of the last decline from the $3,855 high to $3,563 low. Moreover, yesterday’s highlighted major bearish trend line is intact with resistance at $3,720 on the hourly chart of the BTC/USD pair. Finally, the 50% Fib retracement level of the last decline from the $3,855 high to $3,563 low is near the trend line. Therefore, if there is an upside correction, the price is likely to struggle near $3,720 and $3,800. A proper break above the trend line and the $3,800 resistance is needed for a decent upward move. If not, the price may continue to decline and it may even break the $3,500 support in the near term.
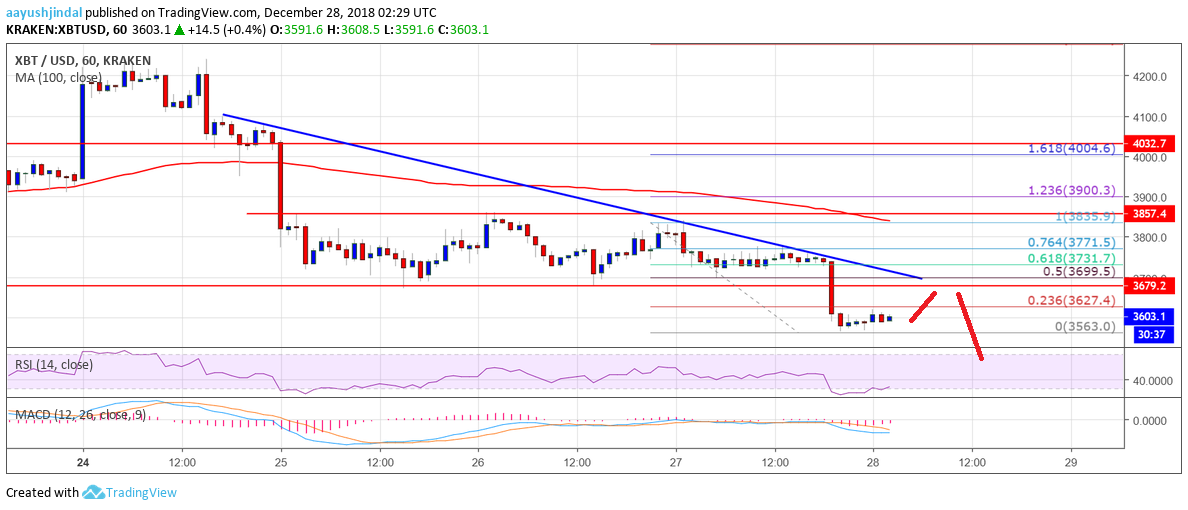
Looking at the chart, bitcoin price seems to be trading with a bearish angle below $3,720 and there are chances of more losses.
Looking at the technical indicators:
Hourly MACD – The MACD for BTC/USD is gaining pace in the bearish zone.
Hourly RSI (Relative Strength Index) – The RSI is moving with a bearish angle below the 40 level.
Major Support Level – $3,500
Major Resistance Level – $3,720
AAYUSH JINDAL | DECEMBER 28, 2018 | 6:00 AM