x




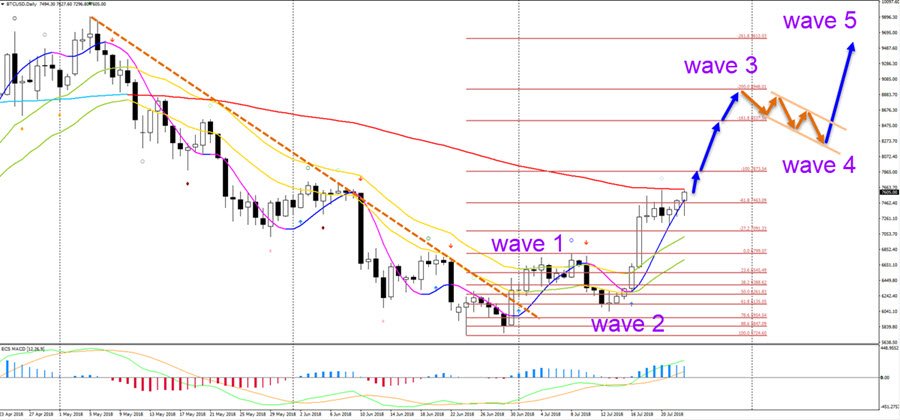
Bitcoin (BTC/USD) is showing strong bullish momentum because multiple daily candlesticks are managing to stay above the 21 ema zone, which indicates that the bulls are fully in control at the moment
2 hour
BTC/USD’s lack of any bearish retracement indicates that more bullish continuation is likely at the moment, which is confirmed when price manages to break above the long-term moving average. A bullish breakout (blue arrows) could take price up to the Fibonacci targets and complete a potential wave 3 (purple). Then a mild bull flag chart pattern is expected (wave 4) and one more push within wave 5 (purple). This will complete a potential wave 1 (blue) – see next image.
The wave 1 (blue) could stop at for instance the previous resistance zone (orange lines), which is also the 10k round level. If price makes a wave 2 (blue) as expected, then price should fall in a corrective 3 wave pattern (ABC zigzag) back to support. The inverted head and shoulders pattern (purple box) could kick start a larger bullish reversal by completing the wave 2 (blue) correction and starting a bullish wave 3 (blue).
4 hour
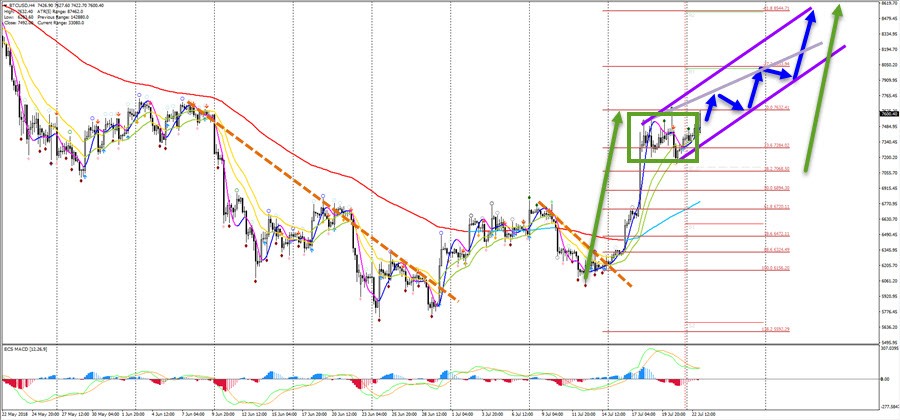
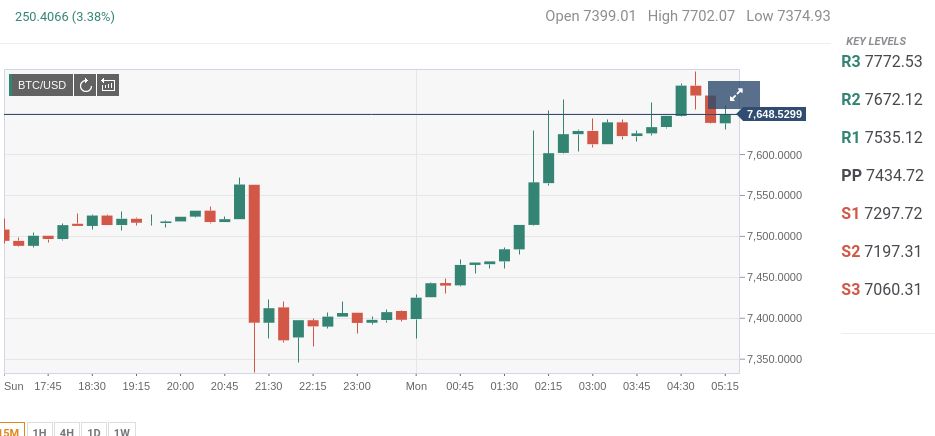
Price is building a consolidation zone (green box) on the 4 hour chart after showing strong bullish momentum (green arrow). Usually the breakout (2nd green arrow) travels the same distance after pushing through the range (green box) as the original impulsive swing (1st green arrow), although the momentum could be less strong. For instance, a bullish channel (purple) could emerge as well. I’m expecting bull flags and continuations towards the Fibonacci targets and weekly Pivot Points for the moment.
1 hour
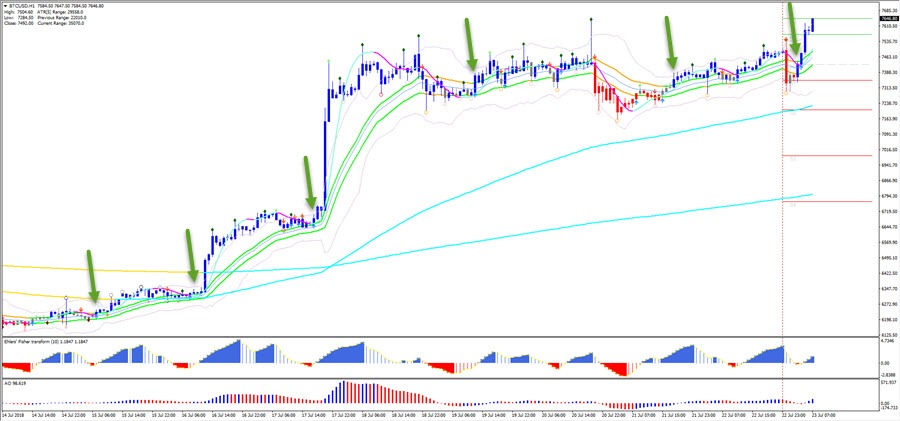
The ecs.SWAT software can be used on Bitcoin as well the 1 hour chart shows. Blue ECS candles above the 21 ema indicate momentum or a new breakout (if its first blue candle), whereas bullish blue arrows indicate potential continuation or loss of momentum (red arrow). The green candles indicate breakout setups.
Author Chris Svorcik