x




Extreme dollar weakness today overcomes sel
ling pressure in gold:
103.80 was and continues to remain an important price level of technical resistance for the U.S. dollar index. The dollar index has flirted with this price point on three occasions, first occurring at the end of 2016 and then again during the first quarter of 2017.
According to Investopedia, the U.S. dollar index (USDX) measures the value of the U.S. dollar relative to a basket of foreign currencies. The USDX was established by the Federal Reserve in 1973 after the dissolution of the Bretton Woods agreement. The index measures dollar strength or weakness against six primary currencies and was updated in 1999.
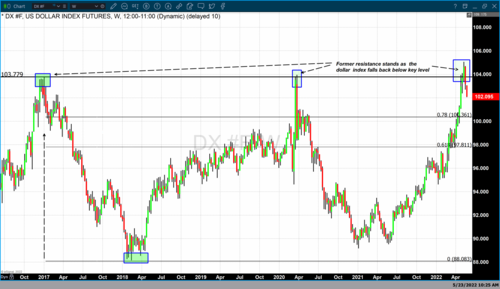
The chart above is a weekly Japanese candlestick chart of the dollar index. It begins at the end of 2016, with the dollar rising to a high just shy of 103.80. This is the first occurrence of dollar strength resulting in the index trading over 100 since the end of 2002.
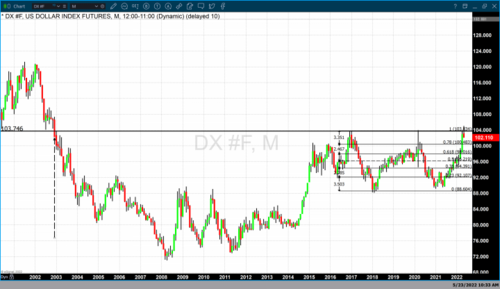
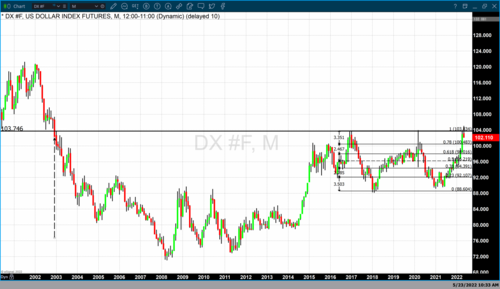
This can be seen in a monthly Japanese candlestick chart of the dollar index below (chart 2). What followed after the dollar surged past 100 at the end of 2016 was a dramatic decline in value from 103.779 to a low of 88.08 during the first quarter of 2018. This represents a price decline of 16% during that year. From 2018 to the first quarter of 2020, the dollar index increased in value until it reached approximately 104, the second occurrence of the index reaching this level and then declining significantly immediately thereafter.
At the beginning of 2021, the dollar had fallen to approximately 89 before finding technical support and resuming a multi-year climb to a higher value. Dollar strength continued and breached this significant technical level 2 weeks ago. The dollar index traded to just above 105 during the week beginning May 9. However, last week the dollar index opened at approximately 104.70 and closed at approximately 103.20. Today the dollar index continued to spiral to lower pricing losing 1.04%. As of 4:55 PM EDT, the dollar index is currently fixed at 102.105.
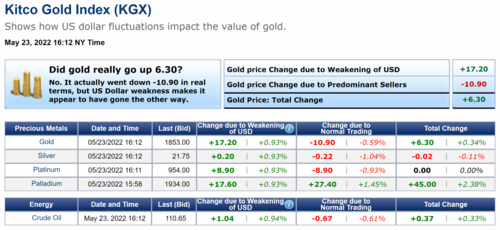
The decline in the U.S. dollar over the last two weeks has given gold significant tailwinds moving the precious yellow metal higher. Gold futures basis the most active June 2022 contract is currently up $9.90 or 0.54% and fixed at $1852. Gains in gold value today were 100% the result of dollar weakness in conjunction with selling pressure from market participants. The screenprint of the Kitco Gold Index above was taken at 4:12 PM EDT and shows spot gold fixed at $1853, a net gain of $6.30. On closer inspection, dollar weakness contributed $17.20 in gains while selling pressure resulted in a decline of $10.90.
By Gary Wagner
Contributing to kitco.com