x




Commentaries & ViewsShare this article:
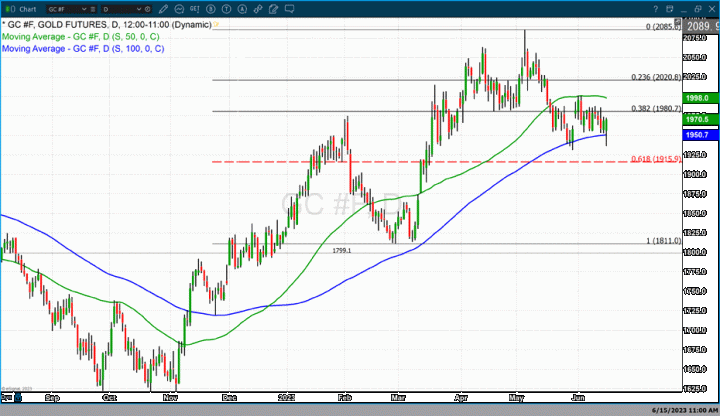
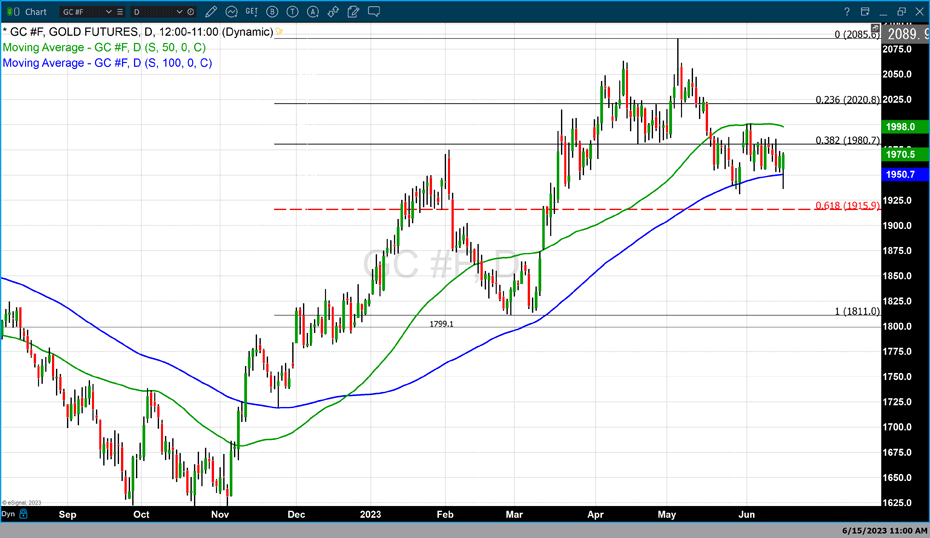
Gold futures basis the most active August Comex contract traded below its 100-day simple moving average which is currently at $1950.70 after trading to an intraday low of $1936.10. However, as of 4:34 PM EDT, gold futures are trading just off the high of $1972.80 and are fixed at $1970.40.
On May 17, gold prices broke below their 50-day moving average for the first time since pricing moved above it on March 13. The rally that occurred in March began in November 2022 when gold had hit a triple bottom just above $1620. The first leg of this rally would take gold to just below $1980 before entering a corrective period which took gold pricing to approximately $1810. On March 13 gold traded back above its 50-day moving average on its way to this year’s highest value just above $2080 in May. After hitting the highest value of the year gold began its current correction that took gold to its current price as seen in the chart below.
That being said, today’s story is not so much about gold closing fractionally higher and back above its 100-day moving average but rather the dollar's strong devaluation and gold’s tepid response. If not for the decline in the dollar index today gold most certainly would have closed strongly in the negative. The dollar declined by 0.77% taking the dollar index to 102.12. Gold futures only gained 0.08% in trading today and when compared to the dollar's decline of 0.77% it indicates that traders were selling gold futures.
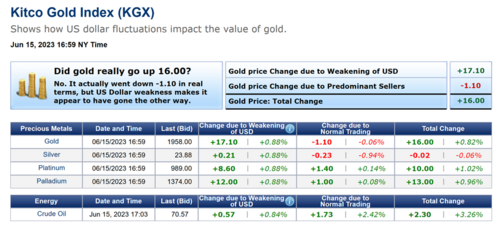
The same can be seen in the pricing of spot gold which increased by $16 per ounce according to the Kitco Gold Index (KGX). On closer inspection dollar strength added $17.10 per ounce, and normal trading resulted in a price decline of– $1.10.
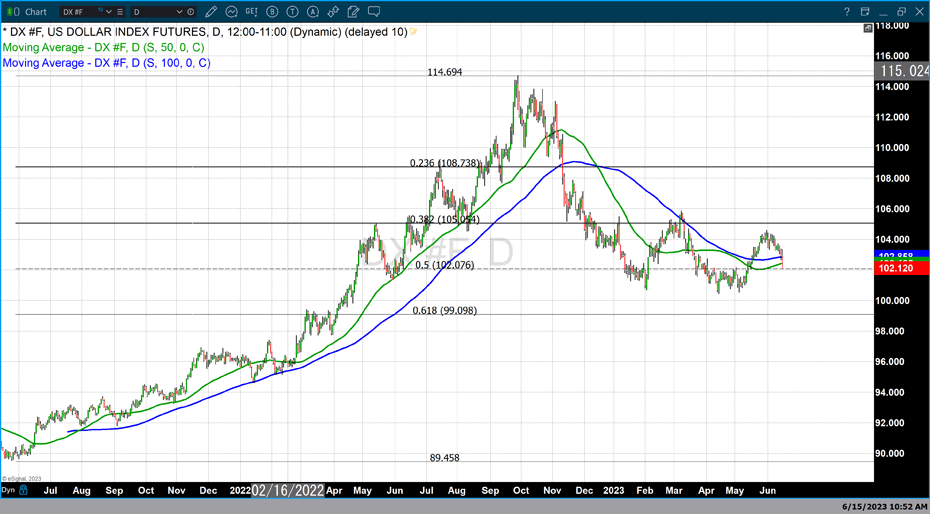
The chart above is a long-term daily Japanese candlestick chart of the dollar index. It clearly illustrates how strong selling pressure has been taking the dollar index (DX) from a high above 114 in September of last year to lows just above 100.50 in February. Each of the last two rallies has had lower highs than the previous. Most importantly today’s strong price decline took the dollar index below both its 100 and 50-day moving averages.
By
Gary Wagner
Contributing to kitco.com