x




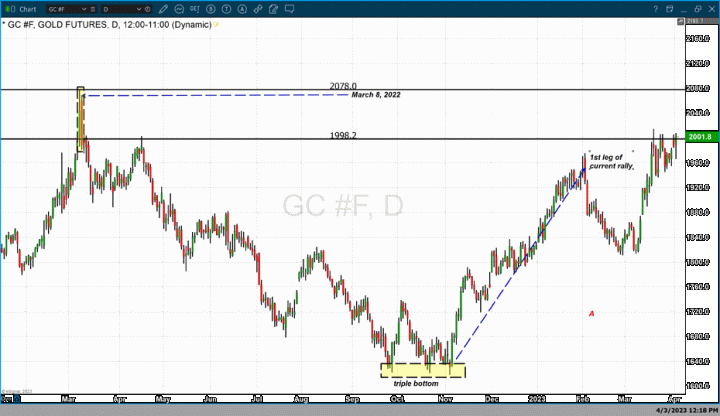
It has been just a little over one year ago that gold futures traded and closed above $2000 per ounce. On March 8, 2022 gold futures opened above $2000 per ounce, traded to a high of $2078 and closed at approximately $2043. Even though gold futures were able to close well above $2000, that price point was unsustainable. On the following day, March 9, 2022, gold opened at approximately $2060 and strong selling pressure drove prices back below $2000 closing at $1988.
Two weeks ago, gold challenged the key psychological level of $2000 per ounce on three occasions, however, gold was unable to sustain gains above $2000 on each occasion.
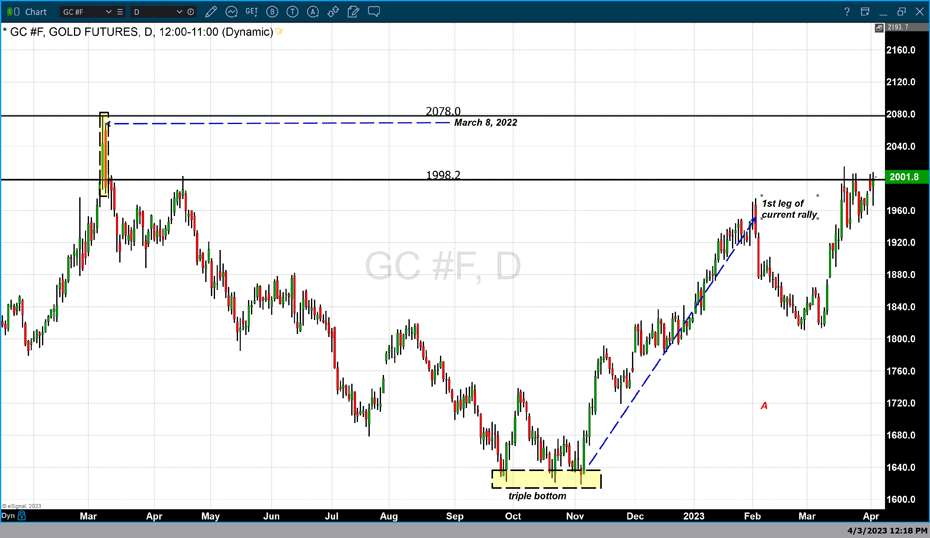
Today, the most active June 2023 futures contract opened at $1990, traded to a high of $2008, and as of 5:40 PM EST is fixed at $2001.70. Gold futures gained $15.50 or 0.78%.
Bullish market sentiment for gold has been evident since November of last year after hitting a triple bottom at approximately $1620 (from September to November). November 3 marked the lowest value of the triple bottom and the end of a multi-month correction. The first leg of the current bull market moved gold from $1620 to approximately $1975 during the first week of February.
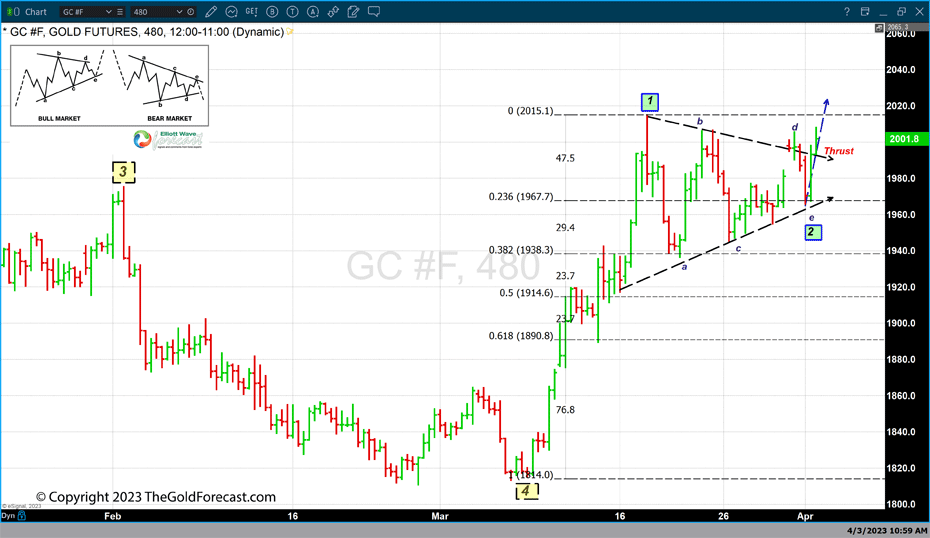
The chart above is a 480-minute bar chart of gold futures (June contract month). It highlights a Western technical chart pattern called a triangle. According to topstockresearch.com, Symmetric Triangles are another type of triangle chart pattern used by traders. Again, like ascending and descending triangles it takes a few weeks to a few months for this type of pattern to form.
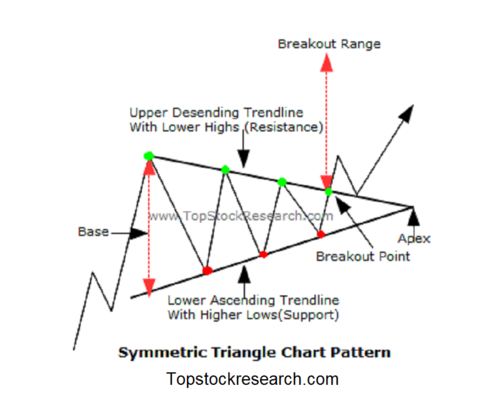
This pattern is composed of a lower ascending trendline which acts as support, and an upper descending trendline which forms the current level of resistance. Prices in this pattern will oscillate between the upper-level resistance trendline and the lower-level support trendline. During a bullish market scenario, you look for pricing to break above resistance, this typically occurs after multiple attempts to breach either the low or the high occurs with a breakout to the upside.
The question as to whether or not gold will be able to sustain its pricing above $2000 per ounce can only be answered after it has held that price point on a closing basis for a number of days.
By
Gary Wagner