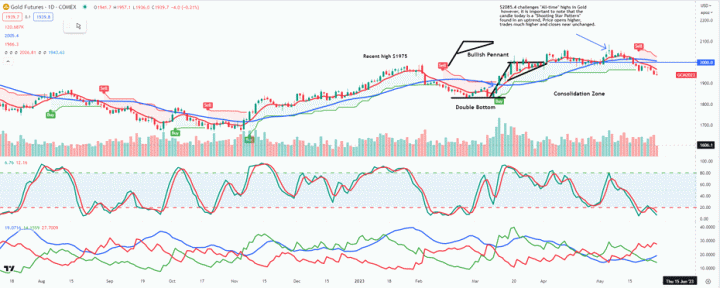

I wish everyone a Happy Memorial Day weekend and thank all of you for the positive feedback over the years, and it is an absolute pleasure to write for you all. Digging into the precious metals markets, we have been under pressure for most of May after the banking crisis became more of an isolated incident rather than the contagion effect everyone feared most. With that story fading into the sunset, a new story surrounding a potential U.S. Default was born where a new batch of speculators piled into the long side of the Gold and Silver while shorting U.S. Equities. Those traders are the ones that often "buy the tops while selling the bottoms" and vice versa. Thursday's massive rally in the Nasdaq and breakdown below $1950 on Gold most likely cleaned those short-term speculators out of the market. As the deadline for the debt ceiling approaches this week, the volatility in the precious metals and equity markets should continue to mount.
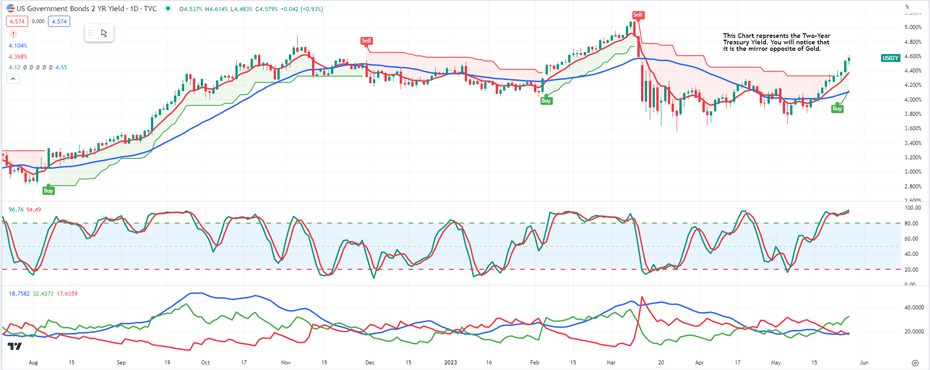
I expect this week to see a last-minute agreement and the "can kicked down the road again," where precious metals will most likely capitulate at that point, making a lower low on the day while closing unchanged or higher on the day. Is that enough to get Gold back to a neutral or bullish trend? Most likely not. We will need U.S. economic data to continue to cool, reducing the expectations of another interest rate hike in July and, ultimately, a "Fed Pivot." At that point, Two-Year Treasury Yields will likely have "peaked," marking a top in the U.S. Dollar and a bottom in Gold. Most of you have yet to see a Two-Year Treasury Yield chart in relation to the Gold market, so I want to share that below.
Daily Two-Year Treasury Yield Chart

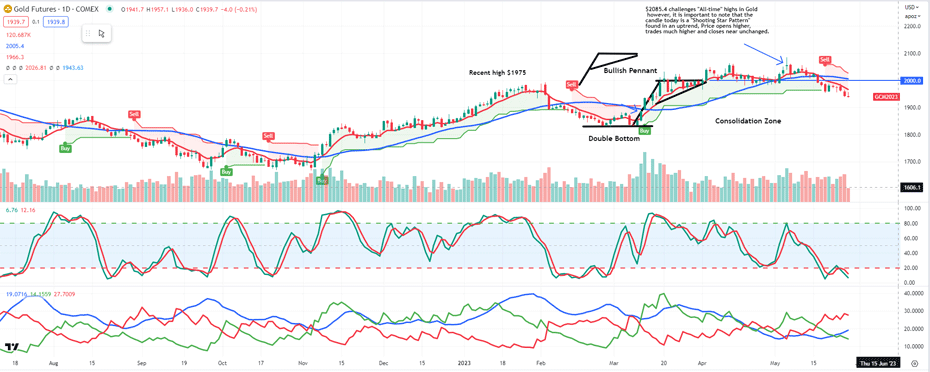
Daily Gold Chart

The technical backdrop leaves Gold in a "bearish trend" as Fed fund futures are pricing another interest rate hike in July and one or two rate cuts by year-end. Gold remains near critical support at $1950 and needs to recapture $1980 on the charts to challenge $2000. Once Gold closes above $2000, the talking heads on financial news networks will wake up and begin the chase again, leaving all-time highs back in play. Remember, the playbook is similar to the 2018-2020 Gold bull market, where the Fed indicated there would be three more rate hikes, and ultimately none happened. The Fed reversed course and started cutting rates. That drove Gold up $650, which leaves our $2500 target achievable in the next 12-18 months.
To further help you develop a trading plan, I went back through 20 years of my trading strategies to create a Free New "5-Step Technical Analysis Guide to Gold that can easily apply to Silver." The guide will provide you with all the Technical analysis steps to create an actionable plan used as a foundation for entering and exiting the market. You can request yours here: 5-Step Technical Analysis Guide to Gold.
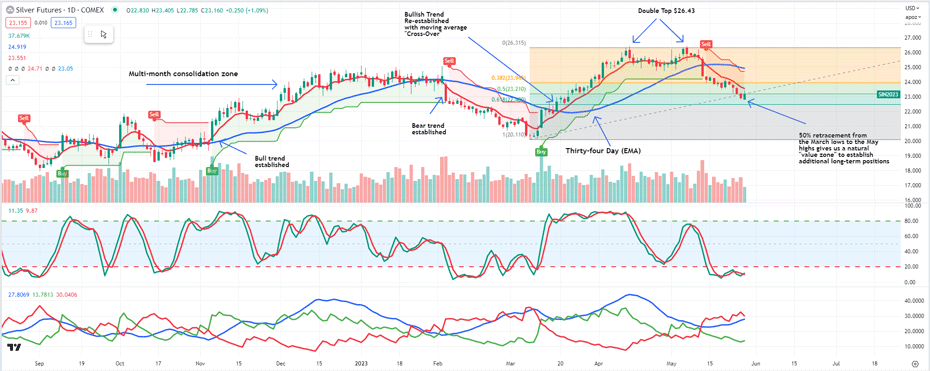
Daily Silver Chart

The chart pattern in Silver has been strikingly similar to that of Gold since the beginning of May, with prices rejecting the first breach of the 50% retracement at $23. The recent correction gives us another excellent opportunity to add to core positions using the December 1000 oz Silver contract. Over the next 18-24 months, we expect Copper to make new all-time highs and Silver to break $35/oz.
Having the flexibility to enter and exit the market quickly makes it essential for Precious Metals investors to have a futures trading account alongside their core Physical Precious Metals holdings. If you are interested in speculating on the rise and fall of the price of Precious Metals on a shorter-term basis, such as two weeks or two months, or If you have never traded futures or commodities, I just completed a new educational guide that answers all your questions on transferring your current investing skills into trading "real assets," such as the 1000 oz Silver futures contract. You can request yours here: Trade Metals, Transition your Experience Book.
By
Phillip Streible
Contributing to kitco.com
