
This week I want to give you an inside playbook on the markets and levels we are watching. First, to be clear, I wrote two articles recently with a gold strategy, buying December micro gold at 1800 and 1755. After filling the 1800 and Gold not responding correctly, we quickly exited for clients with Gold still over 1800 and canceled the rest of the trade. Being the currency that Gold is, rising interest rates, mixed correlations to the Dollar, and more attractive opportunities in other commodities were the main reasons. If you would like to improve your chart reading, we created a Free New "5-Step Technical Analysis Guide to Gold," which you should print out. The guide will provide you with all the Technical analysis steps to create an actionable plan used as a foundation for entering and exiting the market. You can request yours here: 5-Step Technical Analysis Guide to Gold.
Daily Gold Chart

So where did we go?
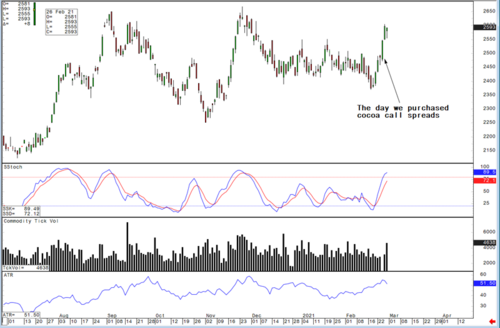
With most commodities inflating at alarming levels, we started deploying capital into commodity-based currencies such as the Canadian Dollar using call spreads. We also recommended buying December Cocoa call spreads. Cocoa could be one of the best performers in the second half of the year and has yet to break out. My hunch is that once lockdown restrictions are entirely lifted, especially in Europe and the U.K., cocoa demand should increase at an exponential level. I am also the author of the "Breakfast Report" that provides actionable trade recommendations in exotic commodities like cocoa, coffee, cotton, sugar. If you are interested, you can request a no-obligation two-week FREE trial of the daily report here The Blue Line Breakfast Report Two-Week Free Trial Sign up.
Daily Cocoa Chart

Diving into commodity metals (Copper, Platinum, and Silver), they finally are having the healthy correction down to levels attractive enough to deploy capital to work. Silver and Platinum had broken down to their crucial support trendlines, and we started to buy the May Silver 1000 oz contracts and April Platinum 50 oz contracts.
Daily Platinum Chart

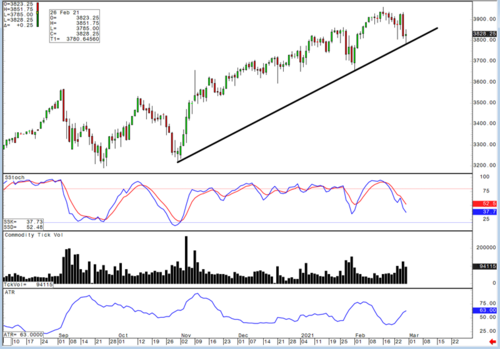
Another futures market we have been active in is the S&P 500. With a correction underway, this has allowed us to step in using the micro contract. We find that the liquidity, smaller contract sizing, and near 24-hour access to the markets enable our customers to move in and out when they want to. That flexibility allows us not to get into the nightmare situation, so many of you expressed to me with AG stock on February 1st in your stock accounts. When you trade individual stocks and stock options, you only can liquidate while the market is open while futures offer more flexibility.
Daily S&P 500 Chart

Technicals: S&P has multiple waves of strong technical support just below the tape; for both, this is a byproduct of such a strong uptrend. We now have major three-star support in the S&P at 3801.50-3807.75, but just below is another wave of major three-star support at 3783.50-3785 that aligns with a trend line from the October 30th low. Indices are certainly on their back foot ahead of the open and must now clear overhead resistance levels to get back on track. For the S&P, this is major three-star resistance at 3851.75-3854.25. If you would like to be up to date on the developments of our strategies in the futures and commodities markets, please register for a Free two-week trial by clicking on the link here: The Blue Line Express Two-Week Free Trial Sign up.
By Phillip Streible
Contributing to kitco.com
Try Kinesis Money System Exchange Gold, Silver and CryptoCurrency
