x




Sure, the precious metal just barely pulled off a gain of +0.3%. However, XAU/USD reversed most of its upside progress in what could have been a 1.8% rally. Let us take a closer look at the price action.
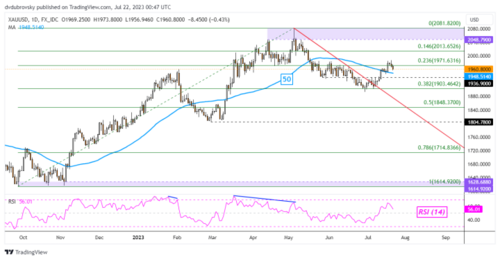
On the daily chart below, gold was seen struggling to hold a push above the 23.6% Fibonacci retracement level of 1971.63. The breakout was false at the conclusion of last week. That is now placing the focus on support. This is a combination of the 1936 inflection point as well as the 50-day Simple Moving Average.
Prices remain above the 50-day SMA, which is offering a cautious upside technical bias. From here, this line may hold as support, reinstating an upside focus. Otherwise, extending lower places the focus on the 38.2% Fibonacci retracement level at 1903, as well as the former falling trendline from May.
In the event of a turn higher, keep a close eye on the 14.6% level at 2013 before retesting the 2048 – 2080 zone.
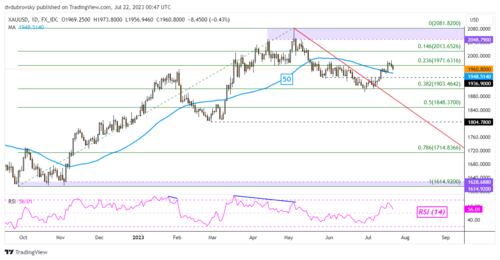
Chart Created in TradingView
It was a slightly worse story for silver prices last week. XAG/USD finished -1.4% over the past 5 trading days. Like gold, there was a false breakout above the 23.6% Fibonacci retracement level of 24.66 as prices were unable to push through the 14.6% point at 25.22. A turn lower from here leaves silver facing the 20-day SMA, which may maintain the near-term upside bias.
But, getting there entails clearing the 38.2% level at 23.75. Clearing both this point and the SMA would offer a stronger bearish conviction, placing the focus on lows from June. Otherwise, extending higher places the focus on highs from April 2022. The latter makes for a range between 25.85 and 26.21.
Silver Daily Chart
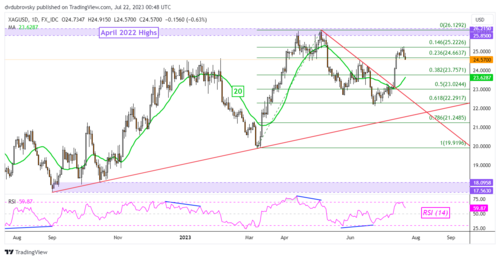
Chart Created in TradingView
--- Written by Daniel Dubrovsky, Senior Strategist for DailyFX.com