x




Bitcoin
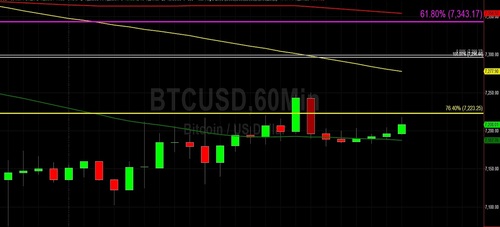
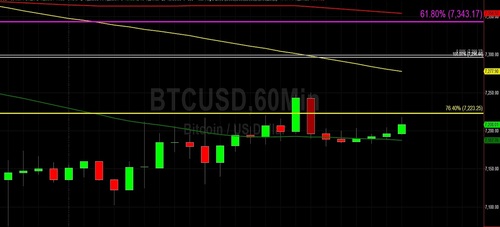
Bitcoin (BTC/USD) came off early in today’s Asian session as the pair depreciated to the 7183.29 area after peaking around the 7249.99 level late in yesterday’s North American session. The pair had steadily appreciated since yesterday’s Asian session when the pair had traded as low as the 7075.01 area. Traders continue to encounter selling pressure when price activity rapidly moves higher with very little follow-on buying giving way to selling pressure that once again has traders eyeing the psychologically-important 7000 figure. This has been seen at least twice this month, including when the pair rocketed to the 7775.00 area before coming off and then again appreciating to the 7659.38 area before again declining.
These spikes in price are being capped at lower highs and are becoming more shallow, increasing the risk of a sharper downward movement as Bids become absorbed during these retracements lower. Chartists anticipate some buying pressure around the 7022 – 7053 range with additional Bids expected around the 6851 – 6899 range. Below those areas, the 6653 and 6323 levels remain downside price objectives related to the late-October high of 10540.49. The 6850.00 area is also one being closely watched, as it was a recent relative low print from 27 November.
Price activity is nearest the 50-bar MA (4-hourly) at 7,350.47 and the 50-bar MA (Hourly) at 7,187.79.
Technical Support is expected around 6775.47/ 6653.57/ 6323.42 with Stops expected below.
Technical Resistance is expected around 7870.10/ 8062.04/ 8338.78 with Stops expected above.
On 4-Hourly chart, SlowK is Bullishly above SlowD while MACD is Bullishly above MACDAverage.
On 60-minute chart, SlowK is Bullishly above SlowD while MACD is Bullishly above MACDAverage.
Ethereum
Ethereum (ETH/USD) weakened early in today’s Asian session as the pair fell to the 144.03 level after trading as high as the 146.12 level late in yesterday’s North American session. Traders had steadily lifted the pair from the 139.10 area during yesterday’s Asian session. Stops were elected below the 141.71 area during the move lower this week, an important technical development because that level represents the 61.8% retracement of the recent 131.80 – 157.73 range. During that move lower, traders stopped just short of testing the 137.92 area, a level that represents the 76.4% retracement of the same range.
If that level is tested and absorbed, it will open up a move to the 132.90 area, a key area that represents the 23.6% retracement of the move from 302.20 to 80.60. If the 132.90 area gives way, traders will focus on the 131.80 area and if Bids around that level are absorbed, traders will eye the 127.14 area as a downside price objective. Major Stops are likely in place below some of these downside levels, especially the 127.14 area because it represents a major downside price objective that became technically relevant following the late-October high of 199.50 and the pair’s subsequent trading activity around the 177.25 area on 20 November.
Price activity is nearest the 50-bar MA (4-hourly) at 146.70 and the 50-bar MA (Hourly) at 143.83.
Technical Support is expected around 137.92/ 131.80/ 127.14 with Stops expected below.
Technical Resistance is expected around 146.59/ 149.31/ 152.11 with Stops expected above.
On 4-Hourly chart, SlowK is Bullishly above SlowD while MACD is Bullishly above MACDAverage.
On 60-minute chart, SlowK is Bearishly below SlowD while MACD is Bullishly above MACDAverage.
December 13, 2019
By Sally Ho