x




BTC/USD sticks to $6,445 amid market indecision.
The imminent breakthrough will be forceful and devastating.
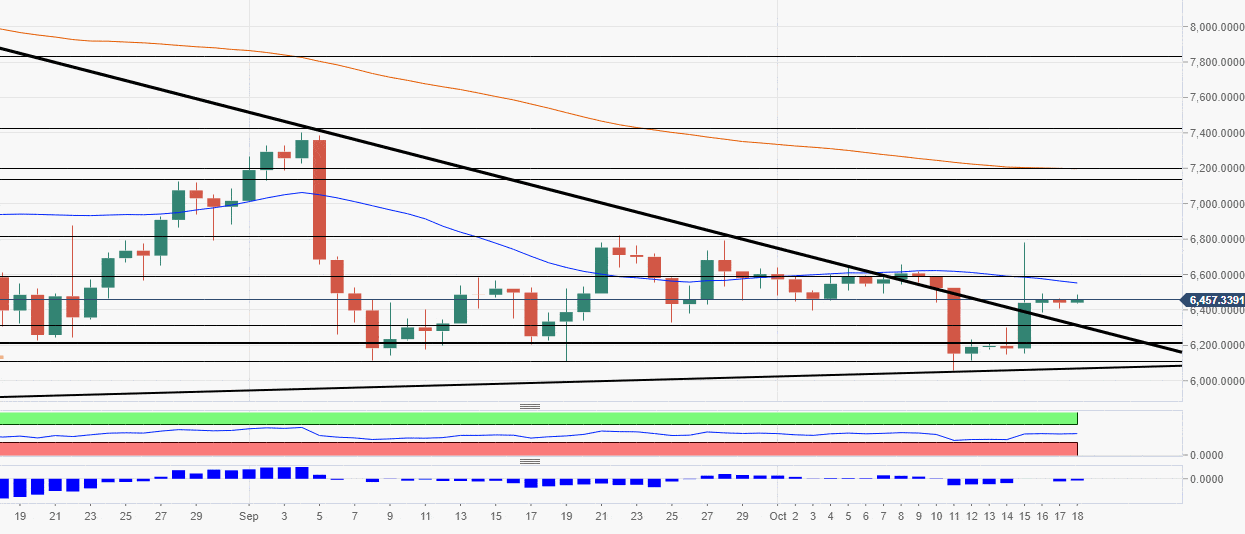
Bitcoin is changing hands at $6,445 at the time of writing. The digital coin No.1 has barely changed since Tuesday, sitting in the tightest range in its recent history. Three doji candlesticks on a daily chart highlight a high level of indecision on the market and promise forceful breakthrough once this coiled spiral starts unwinding.
Bitcoin's technical picture
As it is visible on Bitcoin's daily chart, the price has fairly moved since recovering from long-term sloping trendline on Tuesday. While a sustained movement above $6,400 handle looks positive for the bulls, lack of follow through and a prolonged period of consolidation mires short-term perspectives.
Considering the lack of fundamental catalysts it is hard to predict the direction of the breakthrough; however, the bulls' nearest target is $6,600. This resistance limited the recovery since the end of September. Enhanced by DMA50 and 38.2% Fibo retracement monthly, this level can attract new short-term sellers and push the price back inside the current range.
On the downside, bears are focused on $6,400 with a confluence of strong technical levels clustered on approach. They include 61.8% Fibo retracement weekly, 23.6% Fibo retracement monthly, one day low, Pivot Point 1-day Support 1, and a host of SMA levels. Once below, the sell-off will gain traction and take the price to $6,200 and possibly $6.060 (the recent low).
BTC/USD, the daily chart
Tanya Abrosimova
FXStreet