x


Image Source: Unsplash
Gold remains below $1800 but tentatively holds above the 50-day MA
Gold futures traded to a lower low than yesterday but held above its 50-day simple moving average. Today gold traded to a low of $1785.40, below yesterday's low of $1787.60. That's $0.10 below the 50-day moving average which is currently fixed at $1785.50
This is the cycle length (50-day) market technicians use to indicate whether a stock or commodity is in a short-term bullish or bearish trend. When gold, silver, or the dollar index are above their 50-day moving average, market technicians interpret that market as being in a short-term bullish trend. Simply put, in a sustained uptrend the price of gold will generally remain above the 50-day moving average.
According to Investopedia, "The 50-day simple moving average (SMA) is popular with traders and market analysts because historical analysis of price movements shows it to be an effective trend indicator."
Market technicians use the 50,100 and 200-day moving averages to determine the short-term, interim term, and long-term trend direction. To make this determination even stronger, the averages should be stacked with the shortest time cycle on top and longest on the bottom (in an uptrend), this is known as full bullish alignment.

Image Source: Kitco News
The chart above is a daily Japanese candlestick chart of the dollar with three moving averages plotted (50 in green,100 in blue, and 200-day in red). It is an excellent example of a market that is in a strong bullish uptrend. In August 2021 the dollar index based on these three moving averages came into full bullish alignment. The strength of an uptrend can be visually determined by the distance between each of the moving averages. As long as the averages are in full bullish alignment, and the bullish trend is gaining strength, the distance between the three averages will continue to widen. Read More
Gold, silver lower as crude oil sinks, bond yields rise
Gold and silver prices are lower in near midday Tuesday. Weaker crude oil prices and rising U.S. Treasury bond yields on this say helped to pressure the precious metals markets. Also, recently rallying U.S. stock indexes that hit multi-month highs Monday are pulling away trader/investor interest in the long side of the safe-haven gold and silver markets. October gold futures were last down $7.80 at $1,780.00. September Comex silver futures were last down $0.167 at $20.11 an ounce.
Global stock markets were mixed to firmer overnight. U.S. stock indexes are mixed near midday. Corporate earnings reports are in focus this week. Risk appetite in the marketplace this week is less than robust after some downbeat economic from China that prompted China’s central bank to ease its monetary policy. Also, a weaker U.S. Empire State manufacturing report on Monday has ratcheted up worries about an impending U.S. recession.
Technically, October gold futures bears have the overall near-term technical advantage. A fledgling price uptrend on the daily bar chart has been negated. Bulls’ next upside price objective is to produce a close above solid resistance at the August high of $1,814.40. Bears' next near-term downside price objective is pushing futures prices below solid technical support at $1,725.00. First resistance is seen at today’s high of $1,787.60 and then at 1,800.00. First support is seen at today’s low of $1,775.20 and then at $1,760.00. Wyckoff's Market Rating: 3.5.
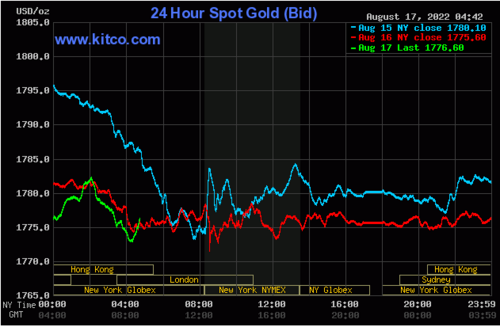
Image Source: Kitco News
September silver futures bears have the overall near-term technical advantage. A fledgling uptrend on the daily bar chart has stalled out. Silver bulls' next upside price objective is closing prices above solid technical resistance at $22.00. The next downside price objective for the bears is closing prices below solid support at $19.00. First resistance is seen at today’s high of $20.25 and then at $20.50. Next support is seen at today’s low of $19.86 and then at $19.47. Wyckoff's Market Rating: 3.5. Read More
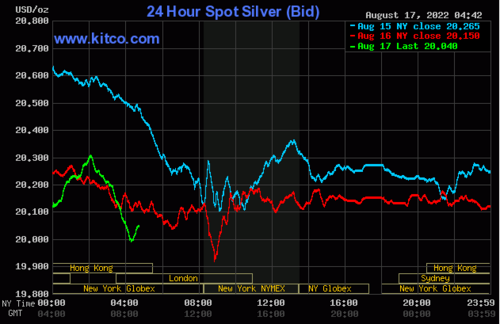
Image Source: Kitco News
Costs are rising for gold miners, here's what that means – BMO
Gold miners have employed many strategies to remain disciplined, but the upward inflationary shock skews rising cost risks to the upside, according to BMO Capital Markets.
"Cost inflationary pressures have been central to many Q2 earnings, with several gold producers already opting to lift cost guidance for the full calendar year and others citing they expect to be at the upper end of guidance," said BMO Capital Markets managing director of commodities research Colin Hamilton said in a recent report.
Gold miners' all-in sustaining costs (AISC) are projected to jump 7% year-over-year to $1,173 an ounce in 2022, Hamilton pointed out.
"All-in sustaining costs are expected to come in at the top-end of guidance, but risks are skewed to the upside. BMO's Precious Metals Team expects the average AISC of gold miners under coverage, excluding those reporting on a June-end basis and primarily silver companies, to increase 7% y/y to $1,173/oz this year," he noted.
During the second-quarter earnings season, eight out of 22 companies under BMO's coverage already lifted guidance, with most citing inflationary pressures as the reason.
Inflation is being reported in many aspects of mining, including labor, diesel, power, royalties, raw materials, and transportation.
"Gold miners don't have a consumer to pass higher costs on to," Hamilton highlighted. "For a lot of businesses, these costs can be passed on to the consumer, which is why producer price inflation is often seen as a leading indicator for further increases in consumer price inflation. In the gold value chain, ultimately, the buck stops with miners." Read More
$2,400 gold will come by 2023, Bitcoin falling to $10k is ‘more probable’ than a rally
Precious metals and Bitcoin have reached pivotal “breakout” points and are on the verge of another major move, according to Patrick Karim and Kevin Wadsworth, technical analysts and founders of Northstar & Badcharts.
Karim and Wadsworth spoke with David Lin, Anchor for Kitco News.
For Bitcoin, the odds are more probable that another move downwards happens before a substantial bull rally takes place, Wadsworth said.
“[It is more] probable that [Bitcoin] is going to break to the downside and head down towards that $10,000 to $12,000 target,” Wadsworth said. “I would assess that the odds that around 70% to 80% likely that we break down to see these lower lows and around 20% to 30% of moving to the upside,” he said.
Wadsworth said that his upside target for Bitcoin would be around the 200-day moving average, around the low $30,000s.
“By the time we move up to meet it, I guess we could be somewhere around $29,000 or $30,000. So that is the upside target and that's the highest I would expect it to get. We may very well start to run out of momentum before then,” he said. Read More
Silver Continues to Hold Above $20 as Metal Sees Volatility Fade Amid No Fresh Catalyst
Silver is still just about holding above $20 an ounce despite a negative price performance so far this week.
For a metal that is often prone to bouts of volatility, silver’s price has traded in a very narrow range just above $20 an ounce so far in August. This underlines the strength of support that silver has now built up around this threshold as well as reflecting the fact the macroeconomic picture hasn’t dramatically changed in recent weeks.
Inflation remains a concern, as shown by today’s high figure out of the UK, with central banks likely to continue implementing a series of interest rate hikes to curb rising prices. Equally, the juggling act central bankers face in curbing inflation while not tipping an economy into recession was evidenced earlier in the week with China’s surprise rate cut following a slowdown in the country’s economy.
Insight into how the US is seeking to balance these dual concerns will be available later today with the release of the minutes of the Federal Open Market Committee's latest meeting. Silver investors will be hoping these minutes point to fewer interest rate rises now needed in the US with the metal very reactive to the actions of the Fed with silver’s multi-month price plunge from April to July triggered by the change to a hawkish approach by the US central bank. Read More
Gold Trades Near $1,775 as Markets Await Fed Minutes Gain Clarity on Bank’s Next Move
Gold is trading around $1,775 an ounce as the markets await the minutes of the Federal Open Market Committee’s last meeting, which should give greater clarity on the US central bank’s view on the current economic situation and the trajectory of future interest rate increases.
Having made considerable gains since dropping below $1,700 an ounce in late July, gold is finding considerable resistance to climb back above the important psychological threshold of $1,800 an ounce. The main driver for the recent price gains has been the prospect of future rate hikes by the Fed being less aggressive and shorter-lasting than previously anticipated. However, this is tempered by the reality that more hikes will nonetheless be needed, which diminishes the appeal of a non-yield-bearing asset such as gold.
Today’s high inflation print in the UK is a stark reminder that while there are signs that the pace at which consumer prices are rising in the US may have peaked, in other parts of the world, inflation is still running away. Gold has so far proven to be driven more by the actions of central banks rather than finding support from its perceived role as a hedge against inflation with this enduring inflation proving a negative for the gold price.
In this environment, it is hard to see where the catalyst may come to push gold back above $1,800 an ounce as long as the US dollar remains as strong as it has been in recent months and while the Fed remains on course for further rate hikes over the coming months. Read More
.png)
Disclaimer: These articles are provided for informational purposes only. They are not offered or intended to be used as legal, tax, investment, financial, or any other advice.

