x


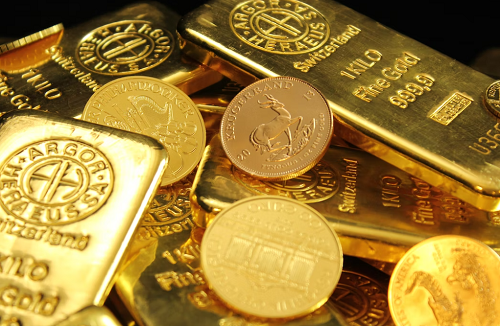
Image Source: Unsplash
Silver Remains Above $19 as Long-Term Demand Balanced Against Rate Hikes
Silver continues to trade above $19 an ounce as investors grapple with the impact of central banks around the world hiking interest rates with a fundamental outlook for a metal that will be in big demand in the energy transition and looks overly cheap as a result.
Silver’s trading picture from September onwards has seen any significant price dips caused by hawkish macroeconomic data or announcements have been followed by a quick mini-recovery. As a result, the metal has traded within the $18-$20 an ounce range for the last month and may well continue within that band for the foreseeable future with rate hikes putting a ceiling on prices while the need for silver in the future will ensure it doesn’t fall below $18. Read More
Gold Steadies Around $1,660 as Markets Assess Economic Outlook
Gold is steadying around the $1,660 an ounce mark as the markets pause for breath awaiting the next significant market driver.
It is hard to see gold making material gains in the current macroeconomic environment with the Federal Reserve, and other central banks around the world, still fixed on a policy of continued interest rate hikes over the coming months to try and bring stubbornly high inflation down. In the face of rising interest rates, gold’s appeal is diminished with its lack of yield making interest-bearing assets such as bonds more attractive instead. Read More
Gold prices see new safe-haven demand as ISM manufacturing index falls to 50.9
The gold market is seeing renewed momentum as weak manufacturing activity in the U.S. drives safe-haven demand for the precious metal.
The latest data from the Institute for Supply Management shows manufacturing activity barely holding in expansion territory in September. The ISM manufacturing PMI fell to 50.9 % last month, missing expectations and down from August’s reading of 52.8%. Economists were expecting to see relatively stable activity at 52.5%.
The report noted that activity is at its lowest point since May 2020 when the global economy was roiled as nations implemented strict lockdown measure due to the COVID-19 pandemic.
“The U.S. manufacturing sector continues to expand, but at the lowest rate since the pandemic recovery began. Following four straight months of panelists’ companies reporting softening new orders rates, the September index reading reflects companies adjusting to potential future lower demand,” said Timothy Fiore, chair of the ISM Manufacturing Business Survey Committee. Read More
Oxford Economics says 4% to 6% allocation in silver will be optimal over the next five years
Improving sentiment in the marketplace is driving the silver market to a six-week high, with prices seeing a solid break above the critical psychological level at $20 an ounce.
Not only is silver supported by solid fundamentals, but analysts note that the precious metal is seeing strong technical momentum after spending most of the summer in oversold territory. Gold is seeing some short-squeeze momentum as prices have broken through major buy stops at $20, $20.25.
December silver prices last traded at $20.48 an ounce, up 7.57% on the day. The precious metal is seeing its best percentage gains since mid-August 2020. Silver is significantly outperforming gold, which is testing resistance at $1,700 an ounce and up 1.38% on the day.
Silver's rally comes a few days after Oxford Economics touted the precious metal's role as an essential asset in an investment portfolio. Read More
Safe-haven buying boosts gold, silver prices sharply higher
Gold and silver prices are posting strong gains in midday U.S. trading Monday. Silver is out-performing and scored a six-week high, while gold notched a three-week high and poked above the key $1,700 level. The two precious metals are catching a solid safe-haven bid as the global stock and financial markets remain jittery, as media outlets are focusing on a desperate Russian president that may resort to using nuclear weapons in his war with Ukraine, and amid bullish outside markets that see higher crude oil prices and a weaker U.S. dollar index on this day. December gold was last up $27.40 at $1,699.20 and December silver was up $1.516 at $20.555.
The marketplace is uneasy to start the month of October, which history shows can be rocky for the stock and financial markets. There are reports and rumors swirling that investment bank Credit Suisse may be in serious financial trouble. Global stock markets were mostly lower overnight. Markets in mainland China were closed for a holiday. U.S. stock indexes are firmer at midday, on corrective rebounds after hitting new for-the-move lows last Friday.
Technically, December gold futures prices hit a three-week high today. The gold futures bears still have the overall near-term technical advantage. Prices are in a six-week-old downtrend on the daily bar chart. Bulls' next upside price objective is to produce a close above solid resistance at $1,750.00. Bears' next near-term downside price objective is pushing futures prices below solid technical support at the September low of $1,622.20. First resistance is seen at today's high of $1,703.20 and then at $1,725.00. First support is seen at $1,675.00 and then at today's low of $1,666.50. Wyckoff's Market Rating: 2.5
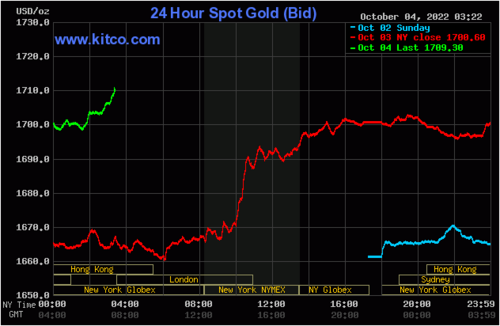
Image Source: Kitco News
December silver futures prices hit a six-week high today. The silver bulls and bears are back on a level overall near-term technical playing field but the bulls have momentum on their side. Silver bulls' next upside price objective is closing prices above solid technical resistance at $22.00. The next downside price objective for the bears is closing prices below solid support at the September low of $19.00. First resistance is seen at $21.00 and then at $21.50. Next support is seen at $20.00 and then at $19.50. Wyckoff's Market Rating: 5.0. Read More
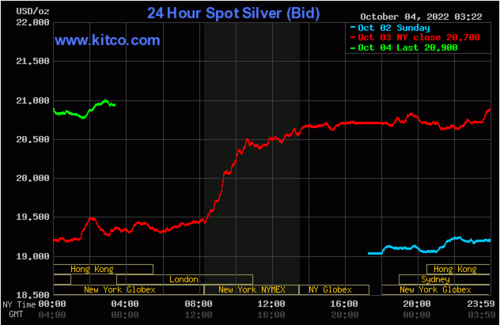
Image Source: Kitco News
Buying opportunity before Fed pivot: Silver price is going to $500, U.S. dollar will crash - Robert Kiyosaki
In another message to his followers, best-selling author of 'Rich Dad Poor Dad' Robert Kiyosaki said it is time to use the Federal Reserve's aggressive stance to buy more gold, silver and Bitcoin.
As the Fed gets ready to raise interest rates by another 75 basis points for the fourth time in a row at its November meeting, Kiyosaki says it is time to do some precious metals shopping, and that includes Bitcoin.
"BUYING OPPORTUNITY: if FED continues raising interest rates U.S. $ will get stronger, causing gold, silver & Bitcoin prices to go lower. BUY more. When FED pivots and drops interest rates as England just did, you will smile while others cry. Take care," he tweeted over the weekend. Read More
U.S. households to sell $100 billion worth of stocks next year, says Goldman
Despite a positive start to the fourth quarter, households could sell $100 billion worth of equities next year, according to Goldman Sachs.
"Rising rates are causing a shift in investor mindsets from TINA (`There Is No Alternative') to TARA (`There Are Reasonable Alternatives'), indicating a weakening outlook for equity demand going forward," Goldman's head of U.S. equity strategy David Kostin said in a note. "We expect households to sell $100 billion in equities in 2023."
Higher interest rates coupled with slower economic growth will deepen the selloff in U.S. stocks, the note said. Goldman sees GDP growth slowing from 1.6% in 2022 to 0.9% in 2023, and the unemployment rate rising from 3.6% to 4%.
After representing the most significant portion of equity demand since the pandemic's start, stock allocations from households have declined since the second quarter, Kostin said. "Investor equity positions remain elevated vs a longer-term history and we forecast further selling in 2023," Goldman's note stated. Read More
With so many gold and silver bears, it doesn't take much to trigger a short squeeze
The U.S. dollar's unrelenting rally at a 20-year high continues to force hedge funds to increase their bearish bets in gold, according to the latest data from the Commodity Futures Trading Commission.
Although there are risks that the U.S. dollar could push precious metal prices lower, analysts note that Monday's 2% rally in the gold market is an indication that the market is susceptible to a short-covering squeeze.
The silver market is seeing an even more substantial short squeeze as prices last traded at $20.71 an ounce, up nearly 9% on the day. Silver is seeing its best daily percentage gain since mid-August 2020.
Gold prices last traded at $1,704 an ounce, their highest level since Sept. 15. According to analysts, bearish gold investors are covering their short bets as rising global economic uncertainty and a potential international banking crisis are driving renewed interest for safe-haven assets.
"There are so many shorts that it just takes a small catalyst to ignite a much bigger rally," said Netish Shah, head of commodity research at WisdomTree. Read More
Gold prices jump as Treasury yields decline and move the dollar lower
Yields on U.S. debt instruments such as the 10-year note, and 30-year bonds have been rising as the Federal Reserve has raised interest rates at each of the last FOMC meetings since March of this year. Currently, the Fed funds rate is between 3% and 3 ¼%.
Today US treasury notes declined by 0.87 points moving the yields from 3.829% to 3.642%. When yields on U.S. debt instruments rise it moves the dollar higher, which also means that when yields decline so does the dollar. That is exactly what we saw today with the dollar declining by 0.45% a total of 0.504 points with the dollar index currently fixed at 111.58.
Last week on Wednesday, September 28 the dollar hit its highest value in the last 20 years at approximately 114.60. The dollar index has closed lower on three of the last four trading days.

Image Source: Kitco News
The chart above is a daily Japanese Heikin-Ashi chart of the dollar index. The Japanese Heikin-Ashi chart is a variation of a standard Japanese candlestick chart in that it uses the same for data points; open, high, low, and close. However, it is the open that is calculated differently than a standard bar or candlestick chart. In both of those charts, the open is fixed from the actual opening price of trading for that day (on a daily chart) and on a weekly chart, the open is fixed from the opening price on Monday and the closing price on Friday. This creates the “real body” regardless of the color. Read More
.png)
Disclaimer: These articles are provided for informational purposes only. They are not offered or intended to be used as legal, tax, investment, financial, or any other advice.

