x


Image Source: Unsplash
USD strength keeps keeping the pressure on
We had suggested $1,785 gold as support should the bulls lose $1,800; that occurred as gold bounced hard off $1,785 on Friday. Silver bore the brunt of last week’s selling, having lost support at its 200-week moving average. Silver investor sentiment has become downright bleak, and experienced metals traders may take this as a contrarian indicator and a sign a bottom could be close
Caution: the current setup in silver is also conducive to a waterfall-type selloff that may see it trade down aggressively this week, to the $18.50 level before a bottom is found. $18.50 is the price at which silver broke out in the summer of 2020 and coincides roughly with the 61.8% Fibonacci retracement.

Image Source: Kitco News
With the USD continuing its ascent to new yearly highs today, the case can be made that gold is holding up very well and continues to churn sideways to set the stage for another leg up once dollar strength subsides in earnest. Read More
Gold, silver pummeled as USDX hits 20-yr. high, crude oil slumps
Gold and silver prices are sharply lower in midday U.S. trading Tuesday. Gold futures hit a 6.5-month low and silver a two-year low today. The precious metals are reeling from a stronger U.S. dollar index that scored a 20-year high today and by big losses in crude oil that saw Nymex crude drop back below $100 a barrel. August gold futures were last down $33.10 at $1,768.40. September Comex silver futures were last down $0.542 at $19.12 an ounce.
Recession fears are on the rise, with some analysts and economists saying the U.S. is already in a recession. Global stock markets were mixed overnight, with Asian shares mostly up and European shares mostly down. U.S. stock indexes are solidly lower at midday.
Technically, August gold futures prices hit a 6.5-month low today. Bears have the solid overall near-term technical advantage. Prices are in a four-month-old downtrend on the daily bar chart. Bulls' next upside price objective is to produce a close above solid resistance at $1,800.00. Bears' next near-term downside price objective is pushing futures prices below solid technical support at $1,700.00. First resistance is seen at $1,783.40 and then at $1,792.00. First support is seen at today’s low of $1,764.30 and then at $1,750.00. Wyckoff's Market Rating: 2.0.
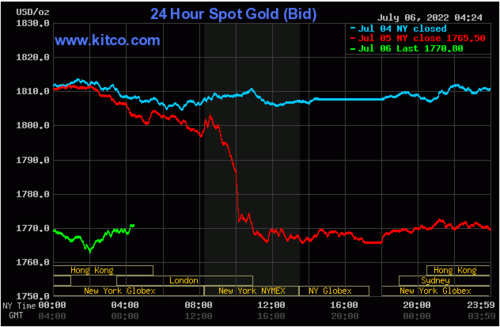
Image Source: Kitco News
September silver futures hit another two-year low today. The silver bears have the solid overall near-term technical advantage. Silver bulls' next upside price objective is closing prices above solid technical resistance at $21.00 an ounce. The next downside price objective for the bears is closing prices below solid support at $18.00. First resistance is seen at $19.50 and then at $20.00. Next support is seen at today’s low of $18.97 and then at $18.75. Wyckoff's Market Rating: 1.0. Read More
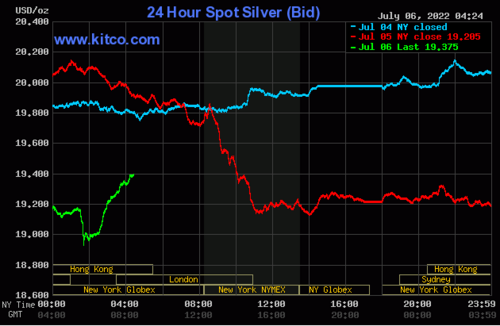
Image Source: Kitco News
Zimbabwe to tame inflation with gold coins
Zimbabwe's central bank will start selling gold coins later this month to try and tame inflation by providing a store of value to the country's plunging currency and giving the population an alternative to the U.S. dollar.
The one troy ounce 22-carat gold coin will be called 'Mosi-Oa-Tunya' and will be available starting July 25. The name means "Smoke that Thunders," referencing Victoria falls.
"Each coin will have a serial number," Zimbabwe's central bank said in a press release. "Upon purchase, the buyer shall take physical possession of the coin and be issued with a Bearer Ownership Certificate. The buyer or holder of the coin may opt to place it in the custody of bankers of own choice in which case a safe custody certificate/receipt will also be issued."
According to the central bank's governor John Mangudya, gold coins can be bought with local currency, the U.S. dollar, and other foreign currencies. The price will be set based on the international price of gold and production costs.
The owners of the gold coins will be able to convert them into cash or trade them. The gold coins could also be used for transactional purposes and as a security for loans.
The coins will be sold by Fidelity Gold Refinery, Aurex, and local banks, according to the press release.
Surging inflation and currency devaluation have made things difficult for Zimbabwe's population. The country's annual inflation was nearly 192% in June. Read More
Central banks step up gold buying in May, June looks promising – WGC
Central banks worldwide bought gold for the second consecutive month in May, stepping up their precious metal purchases, according to the latest data from the World Gold Council (WGC).
Central banks added 35 metric tons to the global gold reserves in May after buying 19.4 tons in April.
The biggest gold buyers were Turkey with additional 13 tons, followed by Uzbekistan with nine tons, Kazakhstan with six tons, Qatar with five tons, and India with four tons.
The only significant central bank seller was Germany, which reduced its gold holdings by two tons in May. The selling was likely because of "its longstanding coin-minting programme," the WGC said.
June is also looking very positive for central bank gold buying, with the Central Bank of Iraq (CBI) announcing that it bought 34 tons of gold in June, which raised its precious metal's reserves to just over 130 tons.
"This is the first significant gold purchase from the CBI since September 2018 (6.5t). This is not yet reflected in IMF data, but we will add this to our statistics next month," the WGC said.
Year-to-date, Turkey has dominated the gold-buying space with its purchase of 56 tons of gold in 2022, followed by Egypt, which bought 44 tons, and Iraq, which acquired 34 tons.
The Central Bank of Bolivia (BCB) also proposed a new law in June that would allow it to become the sole buyer of domestically-produced gold. Read More
A sharp decline in gold results in major technical chart damage
As a direct result of an exceedingly strong U.S. dollar gold prices plummeted today resulting in major technical chart damage. The dollar has gained significant value over the last two weeks, however, longer-term studies reveal that the dollar has been on an upward trajectory since the beginning of 2021 when the dollar index was fixed at 90.
Fears of an inevitable recession based upon rising interest rates have fueled not only dollar strength but also selling pressure in gold on top of that. Collectively, these two forces have moved gold $300 lower from its yearly high in March of $2078 which is a price decline of 15.158%.
On a technical basis, this caused major chart damage from two important technical studies. First, today’s price decline took gold below its 78% Fibonacci retracement. The data set used for this retracement series begins in August 2020 when gold traded to a low of $1671 up to the high in March 2022 of $2078. The second technical study used to confirm that gold has sustained technical chart damage is a compression triangle. Today’s strong price decline took gold pricing through the lower support trendline. The support trendline was created by fixing the two most recent higher lows. The first low occurred on March 16 when gold traded to a low of $1785 with the second low being fixed at $1805 a low that occurred during mid-June this year.

Image Source: Kitco News
Based on continued selling pressure in gold capped by today’s $35 plus decline the question becomes where could gold find technical support? The chart above looks at potential support levels by looking at the most recent price bottoms. The first potential level for support occurs at $1720. This level is based upon a short-term low that was seen in October 2021. Below that is the low of August 2020 when gold hit $1673 before recovering and trading higher. Read More
Gold price erases $35 on U.S. dollar strength, all eyes on FOMC minutes, jobs data
The precious metals market was in the red Tuesday, with gold tumbling $35 as the U.S. dollar index surged to 20-year highs and markets focused on the Federal Reserve's meeting minutes and the U.S. jobs report.
Gold saw a sharp selloff after falling below $1,800 an ounce. August gold futures were last at $1,766.50, down $35 on the day.
"The firm U.S. dollar has caused the gold price to nose-dive further, with the result that it dropped noticeably below the $1,800 per troy ounce mark," said Commerzbank analyst Carsten Fritsch.
The U.S. dollar index climbed to 106.66 Tuesday, once again rising to 20-year highs. The greenback was also trading at 20-year highs against the euro.
Investors are flocking to the U.S. dollar as a safe-haven currency after the Federal Reserve embarked on a very aggressive tightening path to get inflation under control.
Stocks also plunged Tuesday, with the Dow falling 2.3%, the S&P 500 dropping 2%, and the Nasdaq down 0.9% on the day.
All eyes are on the FOMC minutes from the June meeting, with markets looking for clues related to the upcoming rate hike path and any new recession comments from the Federal Reserve members. The minutes are scheduled to be released Wednesday.
"The June FOMC minutes may tilt the balance towards markets fully pricing in a 75bp rate hike at the end of this month, should there be some indication of a growing consensus at the June meeting," ING FX strategists said. Read More
Gold retraces very slightly ahead of the European open
After a tough session on Tuesday gold is trading 0.06% higher leading into the European open. Silver is down just over 1%. In the rest of the commodities complex, copper is down 2.40% and spot WTI has lost 0.60%.
Risk sentiment in the Asia Pac area was negative overnight. The Nikkei 225 (-1.15%), ASX (-0.52%) and Shanghai Composite (-1.72%) all struggled. Futures in Europe are indicating a positive open.
After some serious USD strength on Tuesday, some of the majors are retracing a little. USD/JPY is the biggest mover overnight falling 0.35%. In the crypto space, BTC/USD is trading 1.32% lower at $19,896.
News from overnight: Read More
.png)
Disclaimer: These articles are provided for informational purposes only. They are not offered or intended to be used as legal, tax, investment, financial, or any other advice.

