x






John P. Njui • BITCOIN (BTC) NEWS • AUGUST 22, 2020
In summary:
It is Saturday once again and the daily Bitcoin trade volume has gone contrary to the popular observation of decreasing during the weekend. According to Coinmarketcap.com, Friday’s 24-hour trade volume was approximately $20 Billion. The same Bitcoin trade volume currently stands at $24 Billion thus indicating a positive anomaly in the sense that BTC could benefit from the increased trading activity.
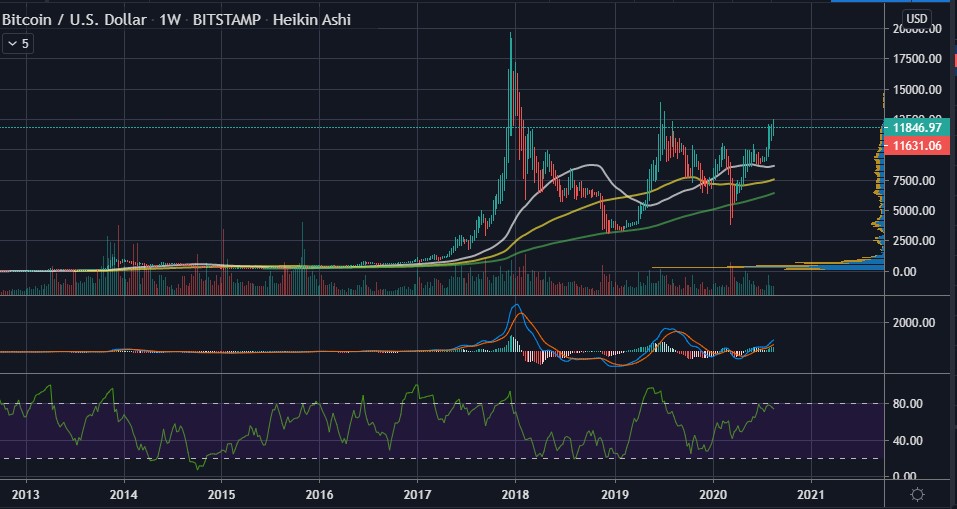
With respect to the price of Bitcoin, there is approximately one week left in the month of August and a monthly close above either $11,600 and $11,200 would be bullish for BTC. To note is that December 2017 was the last time Bitcoin opened and closed a month above both price levels. However, back then, the weekly indicators pointed towards a correction that would start in January 2018.
Checking the weekly BTC/USDT chart once again, it can be revealed that Bitcoin still has some bullish momentum and a monthly close above either $11,200 or $11,600 would help maintain Bitcoin’s bullish momentum.
(Click image for larger view)
Also from the weekly BTC/USDT chart above, the following can be observed.
In an early August tweet, Bitcoin analyst Willy Woo had pointed out that the Bitcoin bull market began in April 2019 and that we are currently in a situation similar to the fourth quarter of 2016. Below is his tweet analyzing Bitcoin.
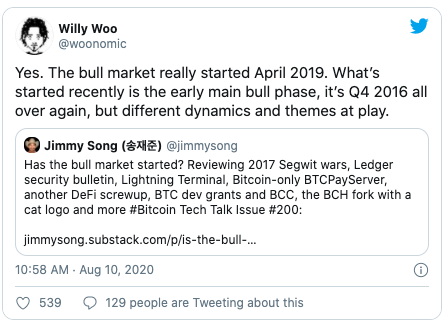
Going by Mr. Woo’s analysis and the weekly chart shared above, it can be loosely concluded that Bitcoin still has room to grow in the markets. Given that the last bull cycle peaked in December 2017, it can be concluded that there are at least another 12 months of positive BTC market action in store for crypto traders and investors.
As with all Bitcoin analyses, BTC traders and investors are requested to have an eye out for any major world events that could skew the price of Bitcoin. Given that we are in the midst of a Global Pandemic, a major increment in COVID19 cases would slow down Bitcoin’s bullish climb or even cause a crash like in mid-March.

Markethive Advertisement
Original article posted on the EthereumWorldNews.com site, by John P. Njui.
Article re-posted on Markethive by Jeffrey Sloe