x






Last week, the creator of the Bollinger Bands indicator, John Bollinger, claimed that he expected for Bitcoin (BTC) to see a “head fake”. Bollinger was absolutely right. Big shock, eh?

For some context, the Bollinger Bands (BB) are a technical analysis indicator meant to determine trading ranges for a cryptocurrency. A BB head fake is when an asset being analyzed falls below or above of the band’s range, then violently snaps back into the range as if the asset had entered a bull or bear trap.
This week, the head fake played out. Perfectly.
On Wednesday, Bitcoin plunged from $8,100 to $7,300 in a secondary breakdown that made analysts across the board flip extremely bearish, partially due to the fact that the lower Bollinger Band was lost. But on Friday, bulls came in to save the day. Within the span of an 18-hour time frame, the cryptocurrency shot from $7,300 to $10,600 — a jaw-dropping 43% move.
What’s interesting is that the BB fractal suggests that Bitcoin’s bullish momentum won’t be pausing here.
According to cryptocurrency trader BitcoinGuru, the massive head fake that Bitcoin just saw clearly satisfies a fractal — when historical price action plays out on current time frames at a different magnitude — that he has been tracking for a while now.
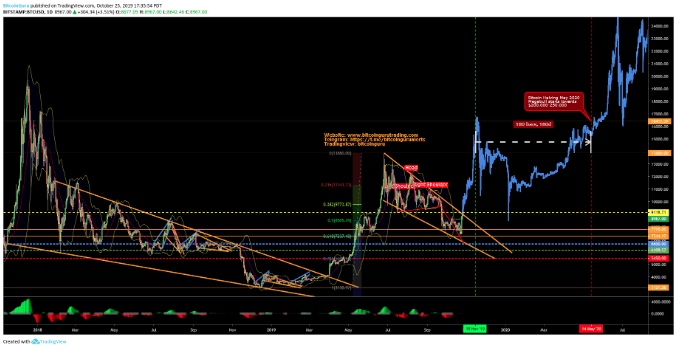
The fractal suggests that the recent drop and subsequent recovery is predicting a massive resurgence, one that will bring Bitcoin higher than its $14,000 year-to-date peak. He wrote that if Bitcoin closes around current levels, he expects for $16,000 to be reached by November 16th. This would represent a 70% move higher from the current price point.
Crazy, but Bitcoin just moved by 42% in an 18-hour time frame, so it isn’t off the table per se.
Technicals support this. Analyst CryptoHamster recently observed that Bitcoin is looking bullish on higher time frames. They recently posted the chart below, which shows that Bitcoin’s current one-week Heikin-Ashi candle has two tall wicks on either side and a skinny green body. For those not versed in technical analysis, this implies a “potential trend reversal.”
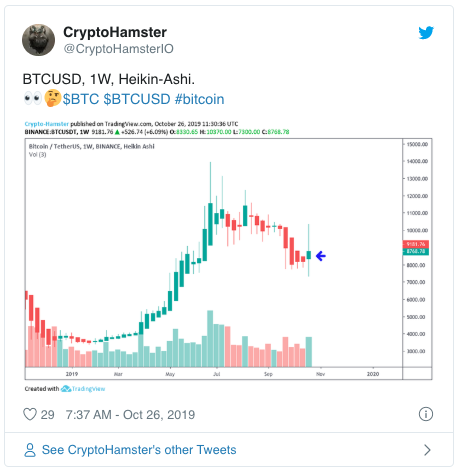
And, another analyst has pointed out that this recent bounce has allowed BTC to retake an essential level, the 200-day simple moving average of $8,900. This is seen as a “bull market” level, making this recent technical occurrence important for bulls.
Original article posted on the EthereumWorldNews.com site, by Nick Chong.