
The Bitcoin 4-hour price chart is seeing a bullish divergence and a TD9 buy as hopes for a relief rally rise.

Image courtesy of CoinTelegraph
The price of Bitcoin (BTC) has rebounded strongly from sub-$17,600 to $18,400 in the past 24 hours. Now, two major technical indicators are signaling the likelihood for a larger relief rally.
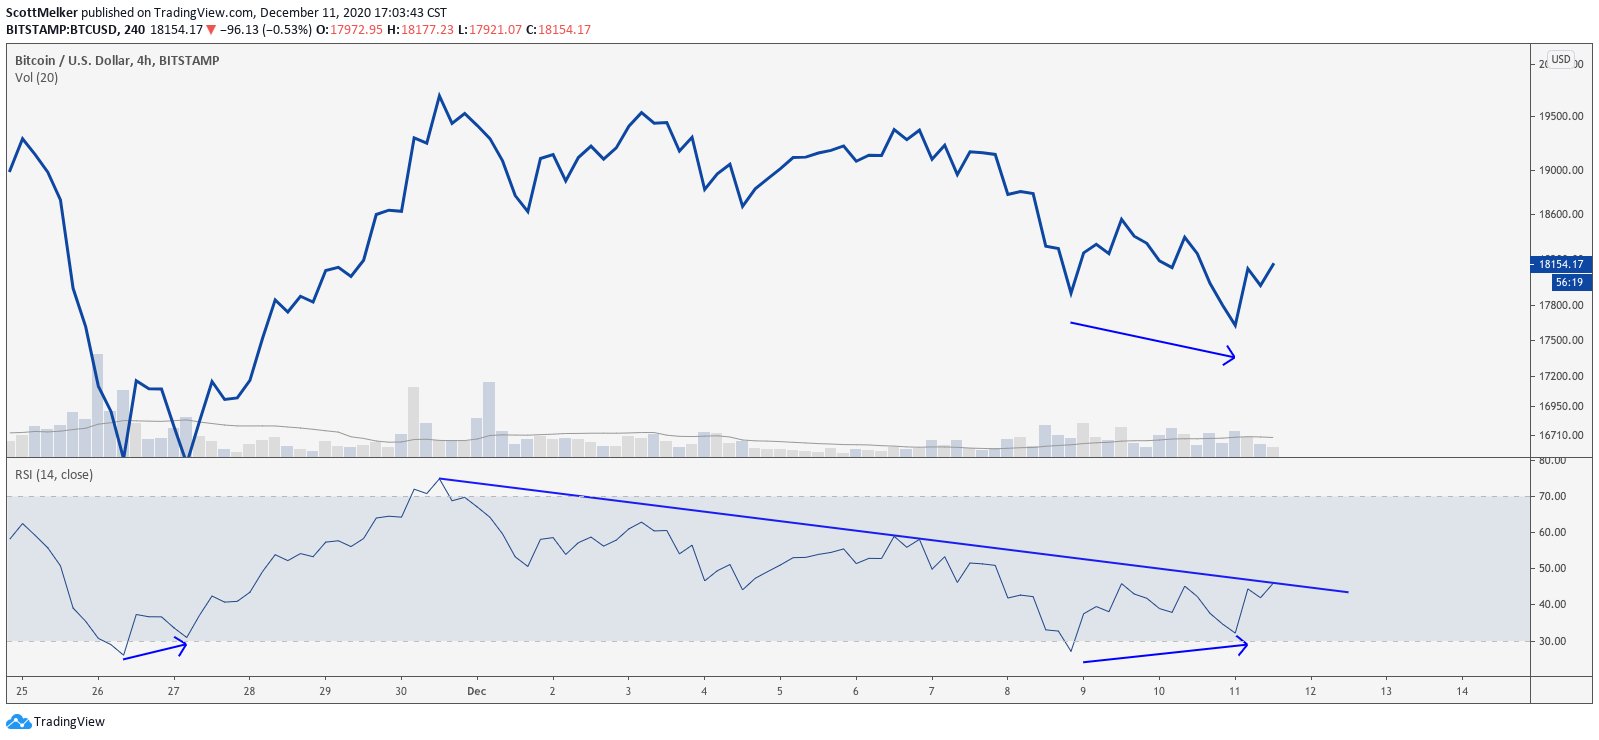
The 4-hour price chart of Bitcoin is showing a bullish divergence just as it prints a TD9 buy signal. Both indicators typically light up when an asset sees a strong sell-off and the selling pressure gets exhausted.
The 4-hour bullish divergence and TD9 buy signal are conceptually similar in that they emerge after a steep correction.
A bullish divergence is a technical pattern that revolves around the Relative Strength Index (RSI). The RSI is a momentum indicator that gauges whether an asset is overbought or oversold.
The RSI has a scale of 0 to 100; under 35 means an asset is oversold and over 75 means an asset is overbought. If the RSI drops below 35 and it begins to recover with an asset, a bullish divergence emerges.

The Bitcoin 4-hour price chart with RSI. Source: TradingView, Scott Melker (Click image for larger view)
Scott Melker, a cryptocurrency trader, said that the 4-hour price chart of Bitcoin showed a bullish divergence as the price recovered above $18,150. He said:
“We all know that we have a beautiful confirmed oversold bullish divergence with RSI. RSI is currently pushing against descending resistance. If it pushes through, price should follow up. No intention of closing my long for now.”
As Cointelegraph previously reported, Bitcoin has seen large selling pressure from whales and miners in the past week. Consequently, the BTC price dropped steeply over the past two days, causing it to be heavily oversold on lower time frames, e.g. the 4-hour chart.
A pseudonymous trader known as “CryptoISO” emphasized that the TD9 buy signal is indicative of an overextended sell-off.
TD9, short for Tom Demark 9, is an indicator that also measures whether an asset is overbought or oversold, similar to the RSI. A TD9 buy signal emerges when the past nine candles are all lower than the four candles prior.
For example, let’s say that the price of Bitcoin has been below $19,000 throughout the past 36 hours. If the 4-hour candle that closed 52 hours ago was above $19,000, it would light up a TD9 buy signal.
The combination of the 4-hour bullish divergence and the TD9 buy signal is indicative that Bitcoin has been heavily oversold in the past three days.
As Cointelegraph reported, whale clusters show $17,170 and $17,700 as major support levels. Hence, as long as Bitcoin remains stable above those two levels, the chances of a continued rally remain high.

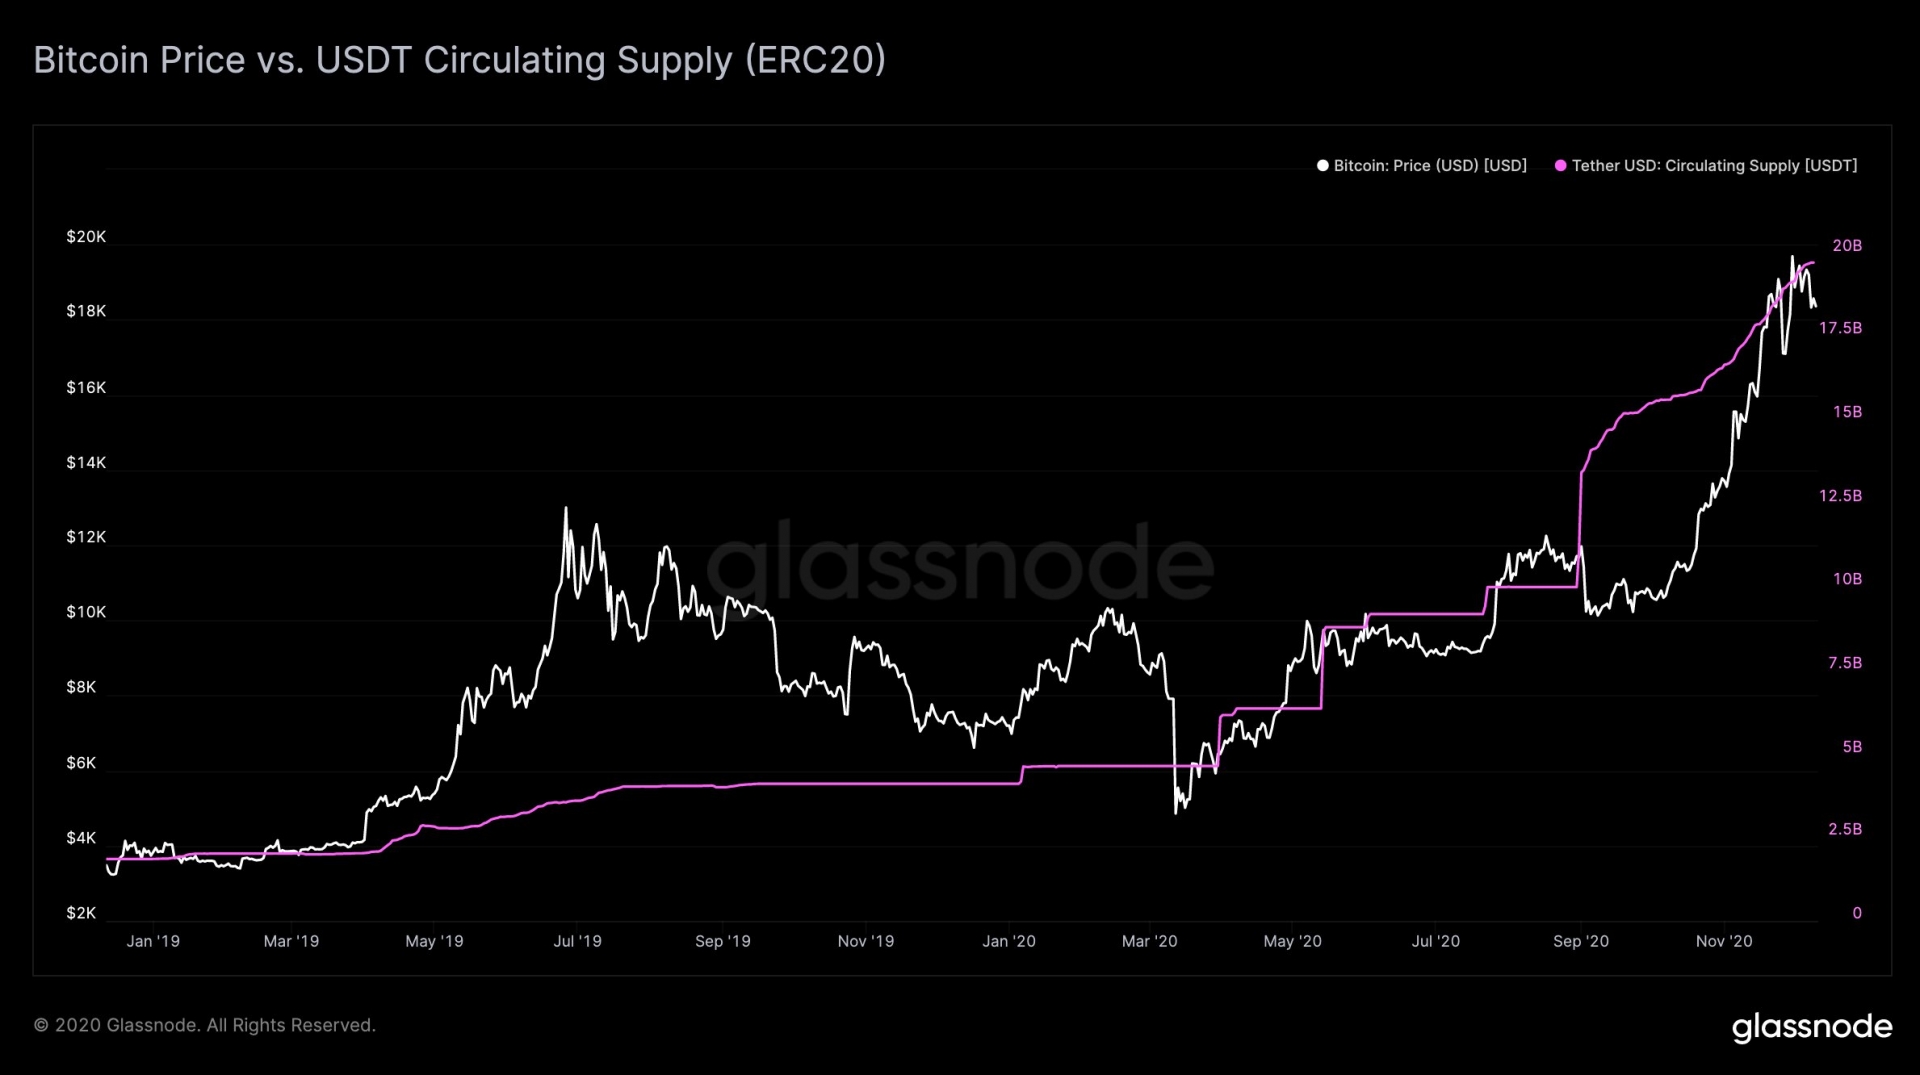
The Bitcoin price versus USDT supply. Source: Glassnode (Click image for larger view)
Another bullish factor above the two whale cluster support levels is the growing supply of Tether (USDT), whose market capitalization now close to $20 billion.
Across major Bitcoin exchanges, like Binance as an example, investors often store sidelined capital in USDT rather than cash, as it allows them to swiftly reenter into positions. The continuous increase in USDT supply is a positive sign of rising confidence toward Bitcoin.
Original article posted on the CoinTelegraph.com site, by Joseph Young.
Article re-posted on Markethive by Jeffrey Sloe
