x







After sustaining a nearly 4% loss over the past two days, Bitcoin started to recover on Friday, rallying as high as $10,380 just minutes ago as of the time of writing this.
While this isn't a strong recovery per se, for the asset remains below its local top of $10,550 (which analysts say is crucial for bulls to break across in the coming days), an eerie pattern suggests Bitcoin is going to rocket higher towards $10,600.
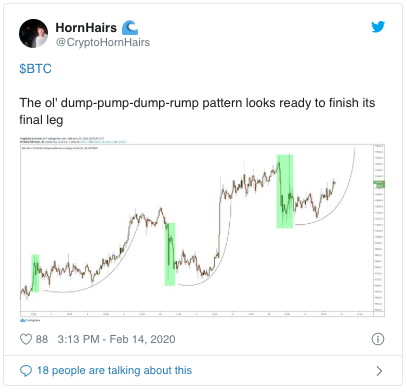
Prominent cryptocurrency trader HornHairs recently noted that Bitcoin's price action has exhibited a clear pattern over the past few days: the pattern sees BTC dump, pump in a parabolic fashion, and crash again as the parabola fails.
Bitcoin is currently in the middle stage, marked by rapidly-increasing prices. The parabola that is forming suggests the price of the cryptocurrency will top around $10,650, around 3.4% higher than the current price of the asset.
Although there is this bull case, a key sell signal just flashed per previous reports from Ethereum World News.
Nik Yaremchuk, an analyst and researcher at cryptocurrency fund Adaptive Capital, recently noted that with Wednesday's close, the one-day and two-day Bitcoin charts are printing simultaneous sell signals: the TD Sequential has printed a green 9s on both time frames.
This is more bearish than bullish because, for those unaware, the time-based TD Sequential prints 9 and 13 candles at reversal points in markets, for it signals that the trend is exhausted.
While the above pattern suggests Bitcoin may crash after it sees a short-term parabolic spike into the $10,600 to $10,700, a daily or weekly close above $10,500, analysts say, will set the stage for an even larger move higher.
Prominent technical analyst Cred — who sports over 140,000 followers — remarked that since $9,500 has been breached, Bitcoin's nearest resistance is $10,500, the midpoint of the tried-and-true range between $9,500 and $11,500.
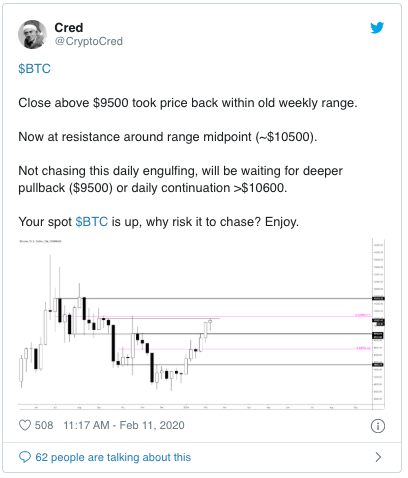
Though, Cred remarked that if Bitcoin can confirm a close above $10,600 — just a smidgen above the resistance he identified — prices will continue higher, likely unfettered until the other long-term resistance he identified at $11,500.
$10,500 is also important because this price point was the top of Bitcoin's rally in September 2019, which was caused by China's embracing of blockchain technologies in an unexpected fashion.
Original article posted on the EthereumWorldNews.com site, by Nick Chong.