x


By Rajan Dhall - Kitco News
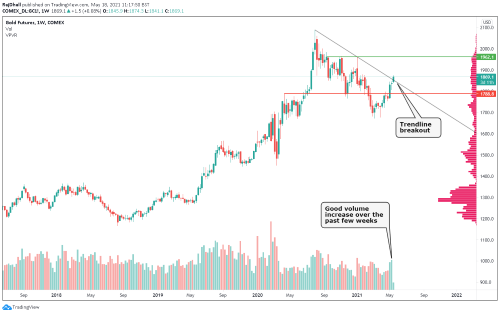
Gold broke through an important level during Monday's session. The trendline originated from the high of $2089.2/oz from August 2020 to the next lower high at $1962.5/oz from January this year. Now, this technical trendline has been broken it is important to note that it has been on the back of pretty good volume.
Having another look at the weekly chart below, the next target for the bulls could be the green resistance line at $1962.1/oz as it has been used on three occasions and seems like a pretty sticky zone. Beyond that, the all-time high could be a longer-term target.
On the downside, first and foremost many times after a trendline break there is often a retest. Below that, the red support area at $1788.8/oz looks strong.
From a volume profile perspective, the main high volume node of this current distribution stands at $1952.6/oz on the upside. This is where most contracts have been traded in close vicinity of the current price. There is another prominent zone at $1835.7/oz that could attract the sellers so keep an eye on some support there.

Disclaimer: This article is provided for informational purposes only. It is not offered or intended to be used as legal, tax, investment, financial, or other advice.
The original article was written by Rajan Dhall and published on Kitco News
.png)