x


By Rajan Dhall - Kitco News
Silver has been moving higher in the European session and is nearly 1% up. Overnight the $27/oz level was defended after some selling pressure over the last couple of days the bulls managed to hold the zone.
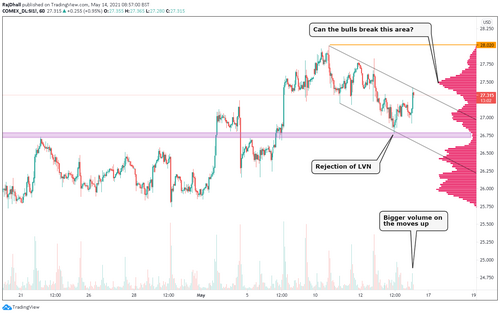
Looking a the 1-hour futures chart below the key feature is the bull flag pattern. At the moment, the top of the structure is acting as a resistance zone. If the pattern does break then the next level on the way up could be the high volume node (HVN) at $27.50/oz. The main target for the bulls could be the wave high on the chart at $28.02/oz.
On the downside, the rejection of the low volume node (LVN) is clear to see at $26.75/oz. Below that, the $26/oz is an area where the price spent soo much time earlier on last month. Now we have had a solid break out it is hard to see the price getting there in the short term.
On one positive note, the volume has been higher on the moves up than it has been on the bearish moves. This is an obvious sign that the bulls are in control and another is the fact that the price waves have made a higher high and higher low.
.png)
The original article was written by Rajan Dhall and published on Kitco News
.png)