x


Since my previous article, Bitcoin has gotten itself out of the mud, and in spectacular fashion, has temporarily reclaimed the $50k level. From that article:
“If without making a lower low down to $24k-$27k, BTC follows the more immediately bullish path to $44k-$49k mentioned in the last paragraph, it could form a potential B wave top, which would send BTC back to the low $20,000s. So if BTC rallies more directly in a more immediately bullish path, the subsequent drop will be our key to determining whether BTC has struck a lasting bottom or whether we have another low to come.”
Unfortunately, for the sake of clarity, BTC followed the more immediate bullish path and rallied up to $49k and even a bit past it without getting a clear break to the lower end of the support zone for the larger pattern.
So where does that leave us?
Well, exactly as stated in the article: “The subsequent drop will be our key to determining whether BTC has struck a lasting bottom or whether we have another low to come.”
Analyzing the form of the rally:
When we observe the move off the June and July lows, we're also without a strong signal of the market’s next move. A clear 5 wave impulsive rally north of $50k would have provided a clear signal that the decline from the April highs is confidently in hindsight. Similarly, a clearly corrective 3 wave pattern - even to levels as high as price has rallied - would have signaled that this rally is a bull trap and allowed us to have confidently forecasted a lower low back to the $24k region, or even perhaps lower. Unfortunately, the shape and proportions of the move do not allow us to clearly discern what sort of structure has been formed since the summertime lows.
While I do slightly lean toward the prospect that price has completed its correction off the April highs, at this time I can’t say with much more than 50% certainty that the lows are in. And so here we are, waiting on that subsequent drop to tell the story. (Please see the youtube.com video below that provides more dynamic visual accompaniment to the verbal analysis.)
3 potential regions to catch price on the coming drop:
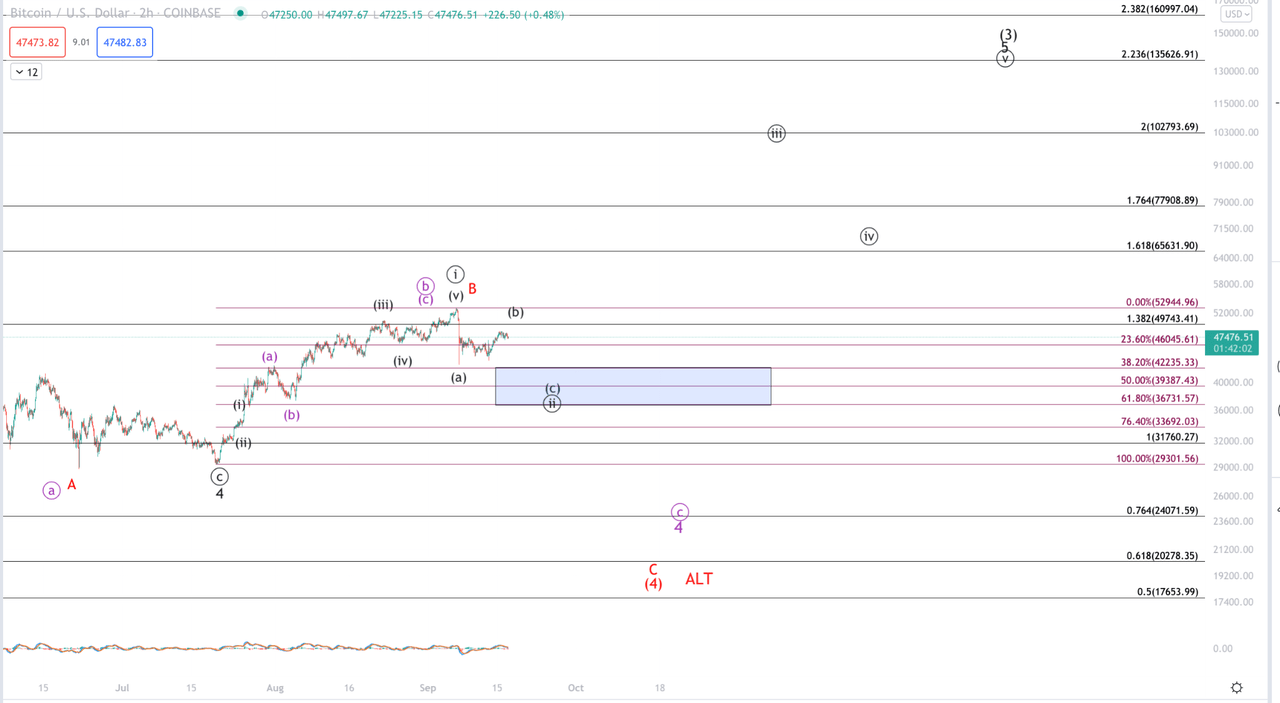
(See the accompanying smaller timeframe chart below.)
Black Count: In this count, we consider the prospect that the lows are in. Pullbacks are buying opportunities. Based on the low and high of the rally structure in question, our first region to watch ranges from approximately $36k-$42k. Should price form a symmetrical 3 wave move from the Sept. 6 high into the aforementioned region and strongly bounce, we will have some additional evidence that the decline is complete and price is on its way to $100k-plus. Confirmation of this count displayed in black notation will ultimately confirm by price maintaining above $36k and breaking out above the Sept. 6 high. Alternatively, should the price make a sustained break below the $33,600 region, we have a strong signal that lower lows are incoming.
Purple count: This count comes into play if price breaks below $33k. Should BTC break below $33k, it will need an immediate rally back north of $41k to avert the then-likely prospect of the lower low. If BTC is going to head down to lower lows, this current decline off the September high should form a 5 wave move. The symmetrical or measured move from the April highs targets $23,900, just undercutting the $24k support region. Based upon the 5 wave structure supposed for this move, after any drop below $33.6k, price should ideally remain below $38,700 on any subsequent corrective rally prior to finishing the structure to a lower low beneath that made in July.
Red Count: Crash! Price follows the form of the purple count, and breaks through $33k but in this case sellers have the momentum to send price resoundingly below the $24k region. The next support region below sits in the $17k-$20k region. A break into that region would severely compromise the pattern that Ryan Wilday and I are tracking. To elaborate:
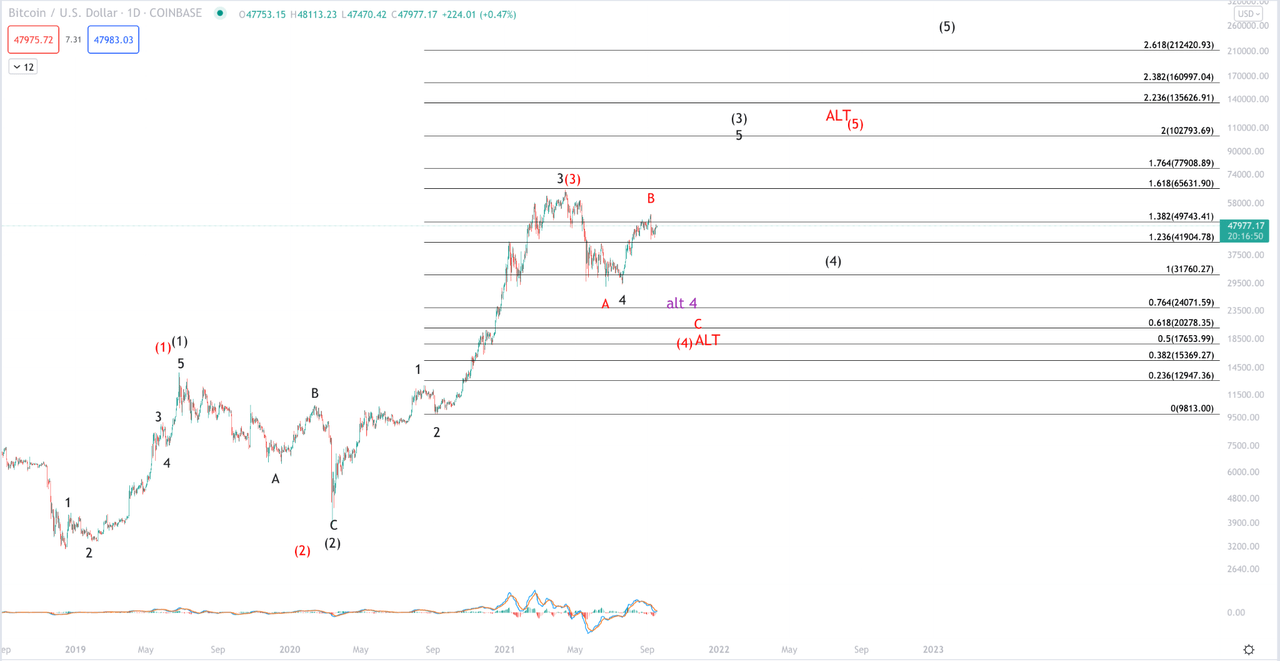
Supposing the lows are in or one more low is seen which avoids a sustained break below $24k: We're looking for two more major highs in this Cycle that began at the December 2018 low. (See the longer time frame chart.)
The first high ideally targets north of $100k (minimally $88k) up to potentially $156k. From that high, our pattern portends a drop back to the $31k-$41k region and then a subsequent high targeting north of $200k. As mentioned, this perspective becomes rather unlikely should a break of $24k be seen. Good news: If price follows the most immediately bearish path dropping all the way down to $17k (even to as low as $11k!), we still expect one more high to develop upwards of $100k. Bad news: That next high would complete a very long-term cycle putting in a lasting top at which point it would likely be a long time before the highs are exceeded.
Lastly, the only potential that has not been covered: The steep drop into the Sept. 7 low will not be broken and price breaks back above the Sept. 6 high. Though I don’t view this prospect as likely due to the corrective nature of the rally since the Sept. 7 low, a resounding break back above $53k would strongly signal that the red and purple counts are not worth considering, that the lows are in, and that price is headed up to its next intermediate target, minimally $88k, ideally north of $100k.
The key takeaway here is to be prepared for all 3 potentials and to see them as opportunities rather than reasons to panic.
Smaller time frame chart
Larger timeframe chart