x





Ethereum surged to a two-month high above $1,900 on Thursday, as the token continued to rally following yesterday’s U.S. inflation report. Inflation in the United States was at 8.5% in July, giving traders some optimism on a potential gradual recovery. Bitcoin was also in the green, as prices moved closer to $25,000.
Bitcoin (BTC) was up for a second straight session on Thursday, as prices continued to react to the latest inflation report.
Following a low of $23,031.88 on Wednesday, BTC/USD surged to an intraday peak of $24,669.13 earlier today.
The move saw the world’s largest cryptocurrency rally to its long-term resistance level of $24,600 for the first time since July 30.
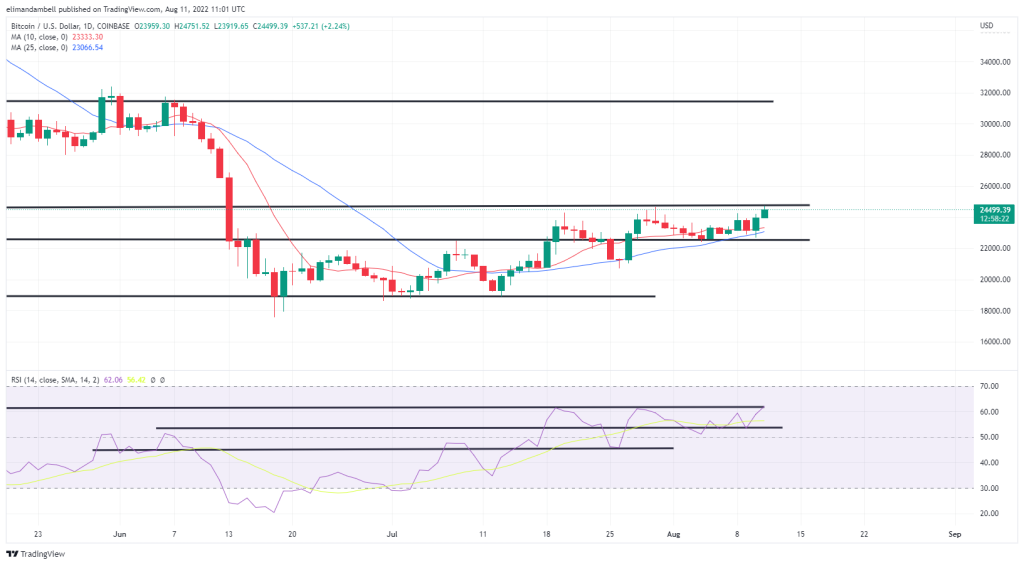
BTC/USD – Daily Chart
As on that occasion, the ceiling has so far held firm, with earlier gains easing as the session has progressed.
BTC is currently trading at $24,485.78 as of writing, and this coincidentally comes as the 14-day relative strength index (RSI) collided with a resistance level of its own.
This level is the 62 mark on the indicator, which has been in place since early April, and should bulls look to take the token above $25,000, then this hurdle must be passed.
Ethereum (ETH) also rallied earlier in today’s session, as prices of the world’s second-largest token climbed by over 10%
On Thursday, ETH/USD raced to a high of $1,908.20, which comes less than 24 hours after the token was at a low of $1,693.05.
The move came as ETH broke out of its long-term resistance level at $1,785, before hitting the peak, which is the highest point the token had traded at since June 6.
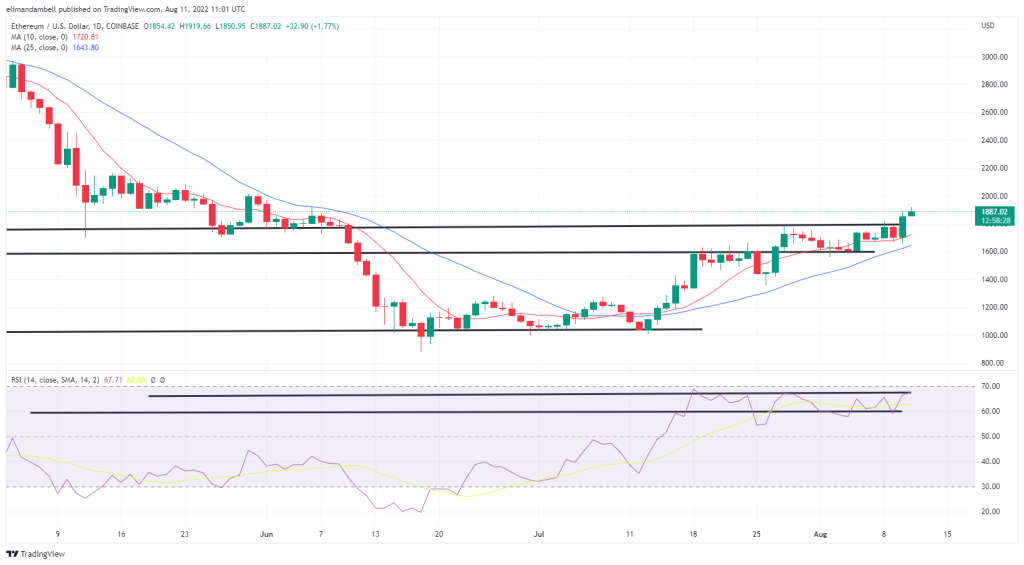
ETH/USD – Daily Chart
Looking at the chart, earlier gains in ethereum have also faded, and like BTC, this comes following a collision with a resistance point.
On this occasion, the ceiling is the 68 mark on the RSI, which hasn’t seen a full breakout in over four months.
Despite this, some bulls remain optimistic about ETH’s chances to extend this run, and climb higher in upcoming sessions.