
Bitcoin hovers around $81,966 to $82,126, commanding a market valuation of $1.62 trillion and a daily trading volume of $19.42 billion, oscillating between $81,287 and $83,340 amid a downward trajectory visible across multiple intervals.

Bitcoin
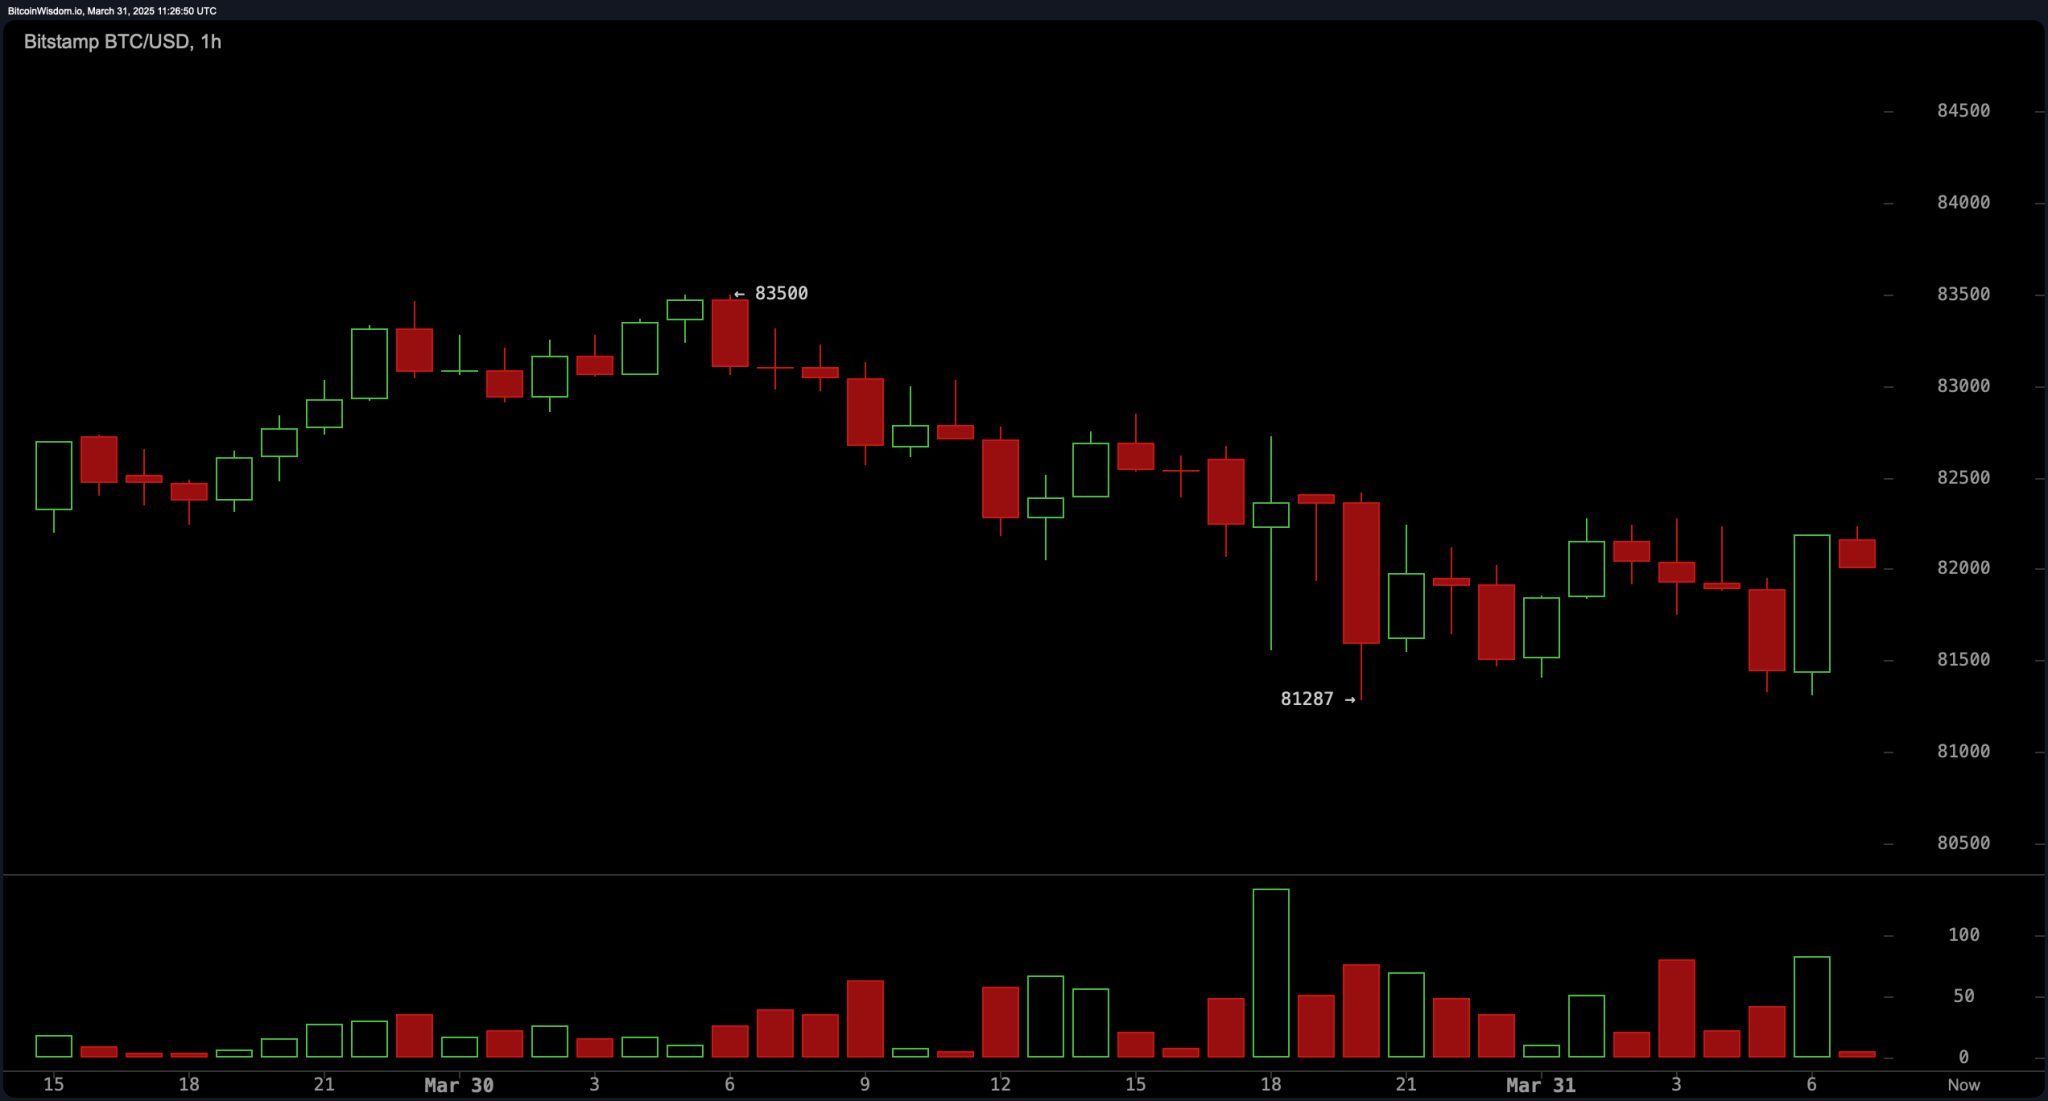
Bitcoin‘s 1-hour chart paints a vivid portrait of decline, with prices retreating from a recent zenith of $87,481. A formidable resistance barrier looms near $83,000, while immediate support hovers near $81,000. BTC’s trading activity corroborates this pessimistic stance, as sellers dictate market dynamics. Speculators might explore short positions during feeble rallies, positioning protective stops above recent peaks. A decisive leap beyond $84,000, accompanied by amplified activity, could hint at trend rejuvenation.
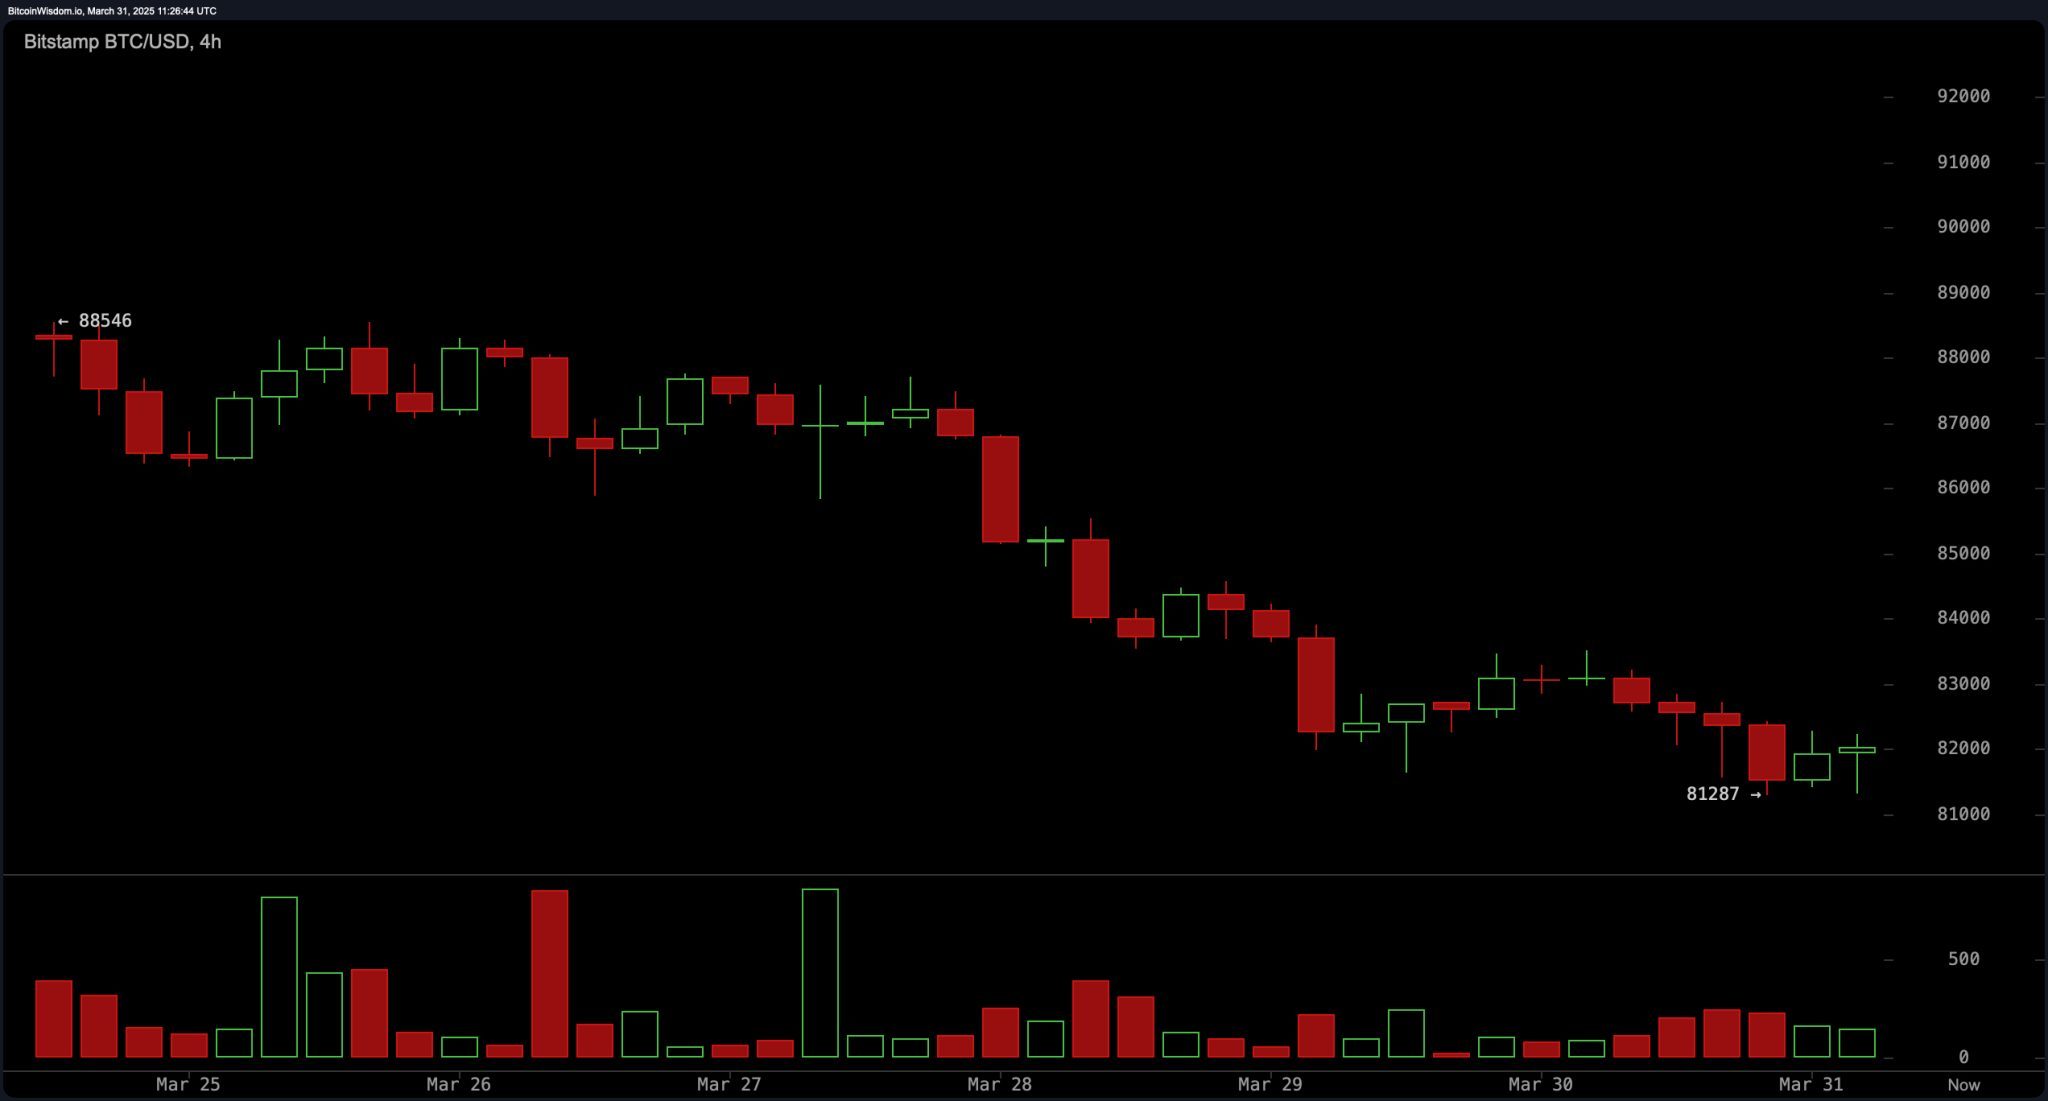
Zooming to the 4-hour view, bitcoin carves a pattern of diminishing peaks and troughs, amplifying negative sentiment. Resistance persists steadfastly between $85,000 and $86,000, while support near $81,500 has faced repeated examinations. A collapse beneath this floor might intensify downward momentum, whereas conquering $86,000 could spark a transient bullish phase. Observing activity spikes remains critical for detecting inflection points.
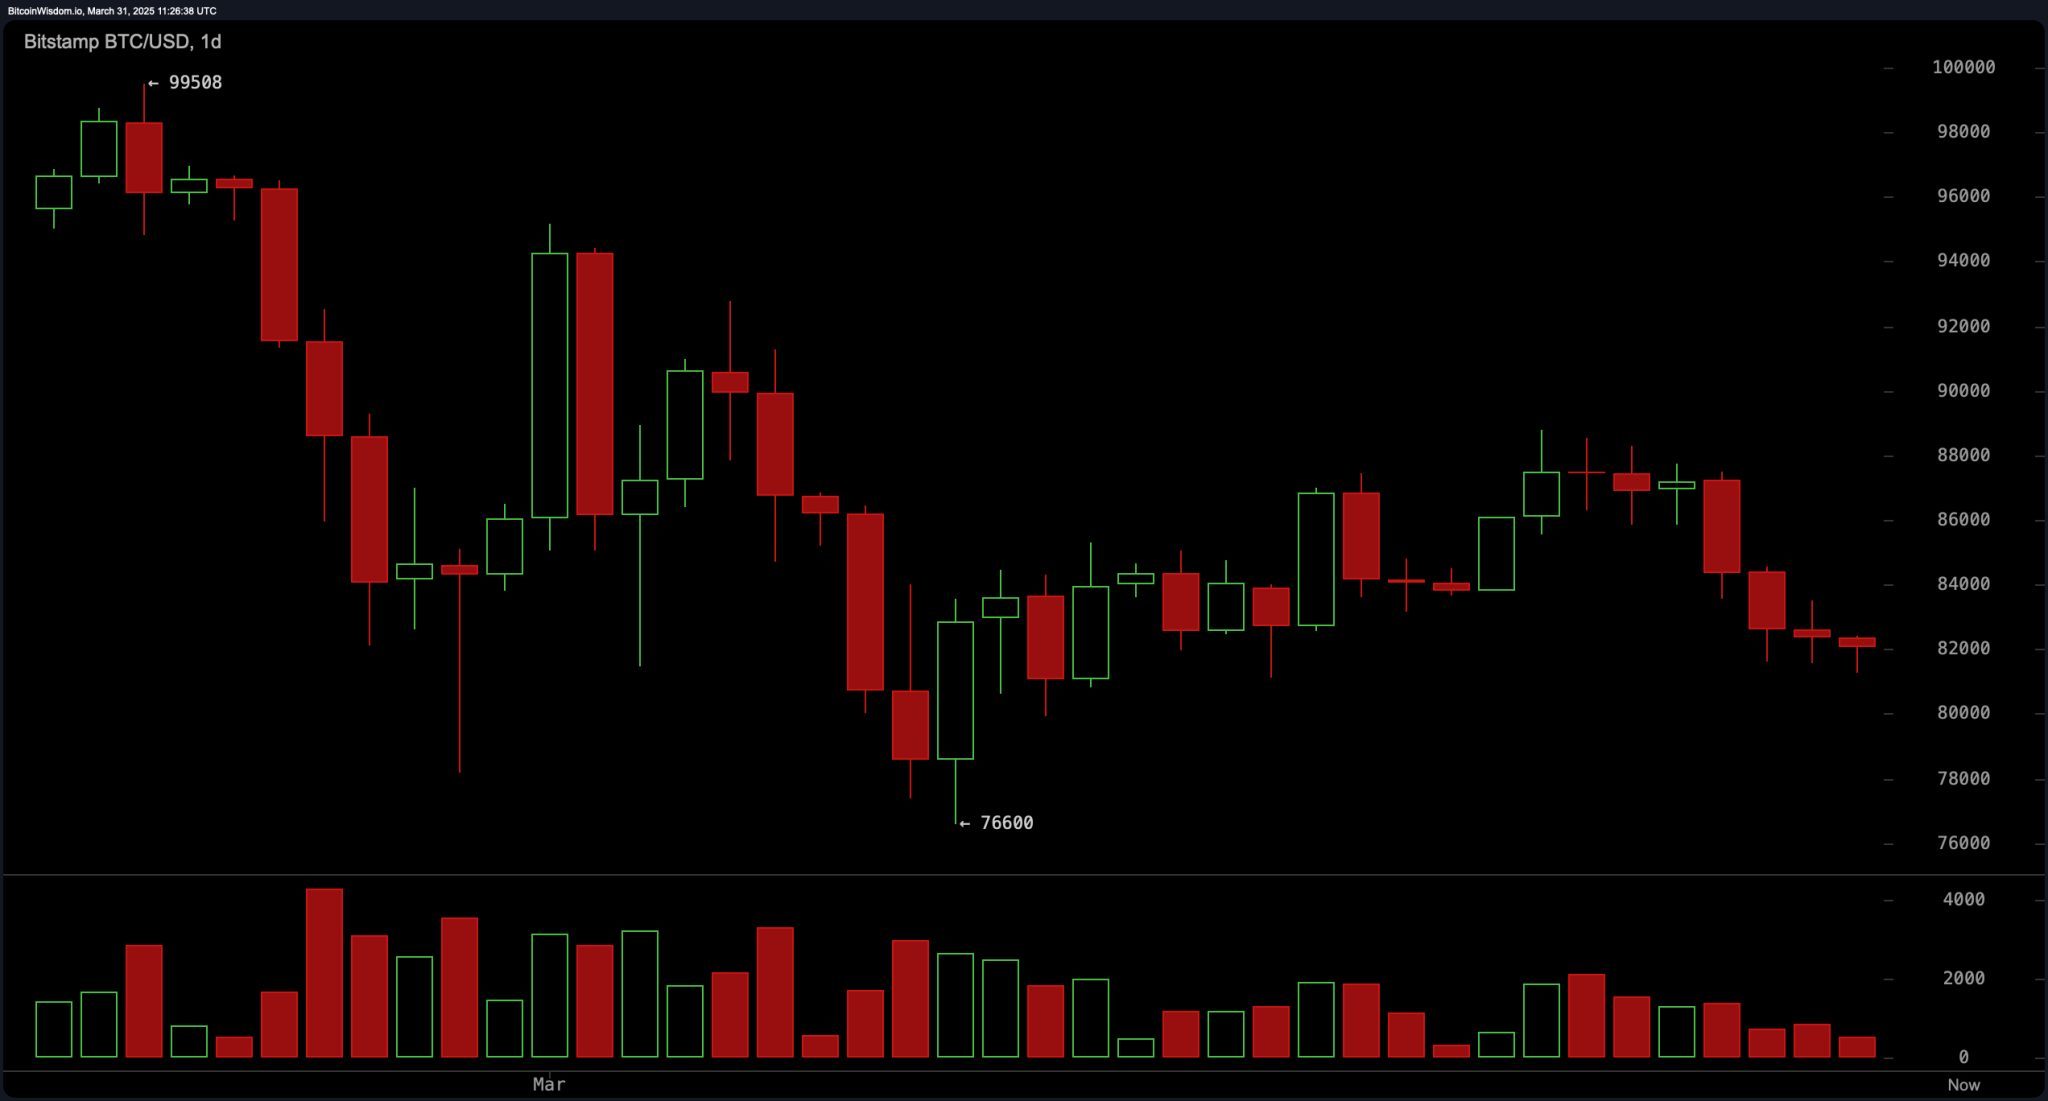
Bitcoin‘s daily lens reveals an extended descent, hemmed by formidable resistance near $90,000 and critical support near $76,600. Buyers remain conspicuously absent, stifling attempts to reverse the slide. Prudent investors may adopt a watchful posture, scrutinizing the durability of $76,600 or preparing for deeper losses. Only an emphatic close above $90,000 would disrupt the bearish narrative.
Technical oscillators paint a mosaic of conflicting signals. The relative strength index (RSI-43), stochastic (49), CCI (-32), ADX (23), and awesome oscillator (656) collectively reflect equilibrium. Momentum (-3,954) lingers in negative terrain, while the MACD (-831) hints at potential long opportunities. Ambiguity prevails, leaving participants craving clearer directional cues.
Moving averages (MAs) uniformly flash pessimistic signals. Both EMAs and SMAs—spanning 10 to 200 periods—advise selling, with the 10-period EMA at $85,196 and the 200-period SMA at $85,809. Bears retain control with prices lingering beneath every major average unless a forceful breach above pivotal resistance materializes.
Fibonacci retracements highlight critical thresholds. On daily scales, bitcoin languishes below the 50.0% mark ($88,054), exposing vulnerability to additional losses unless reclaiming the 61.8% level ($85,350). The 4-hour chart sees resistance converge near $85,728 (50.0%), while the 1-hour frame shows price dancing around $84,517 (61.8%). A decisive breach above these markers could herald momentum shifts; failure to hold $83,711 invites further erosion.
In sum, bearish winds blow forcefully across all intervals. Active traders may favor strategic short positions absent unambiguous reversal signals, while vigilant observation of activity and resistance thresholds will illuminate potential turning points.
Bull Verdict:
If bitcoin breaks above key resistance levels, particularly $85,000 on the 4-hour chart and $90,000 on the daily chart, supported by strong volume, bullish momentum could regain control. A successful breach would likely signal the end of the current downtrend, encouraging buyers to re-enter the market and potentially pushing prices toward previous highs. Positive signals from the MACD and increasing momentum would further reinforce a bullish outlook.
Bear Verdict:
Bitcoin’s consistent failure to break through resistance, combined with sell signals from all major moving averages and bearish pressure visible across all timeframes, supports a bearish outlook. If the price loses support at $82,685 and breaks below $81,287, further downside becomes likely, with $76,600 serving as the next critical level. Weak buying pressure and ongoing negative momentum suggest traders may continue favoring short positions in anticipation of further declines.