x





Bitcoin is trading at $105,971 to $106,032 over the last hour, with a market capitalization of $2.10 trillion and a 24-hour trading volume of $21.88 billion. During the past 24 hours, the price has fluctuated between $104,004 and $106,450, reflecting a narrow intraday range that coincides with ongoing technical indecision across broader timeframes.Bitcoin is trading at $105,971 to $106,032 over the last hour, with a market capitalization of $2.10 trillion and a 24-hour trading volume of $21.88 billion. During the past 24 hours, the price has fluctuated between $104,004 and $106,450, reflecting a narrow intraday range that coincides with ongoing technical indecision across broader timeframes.
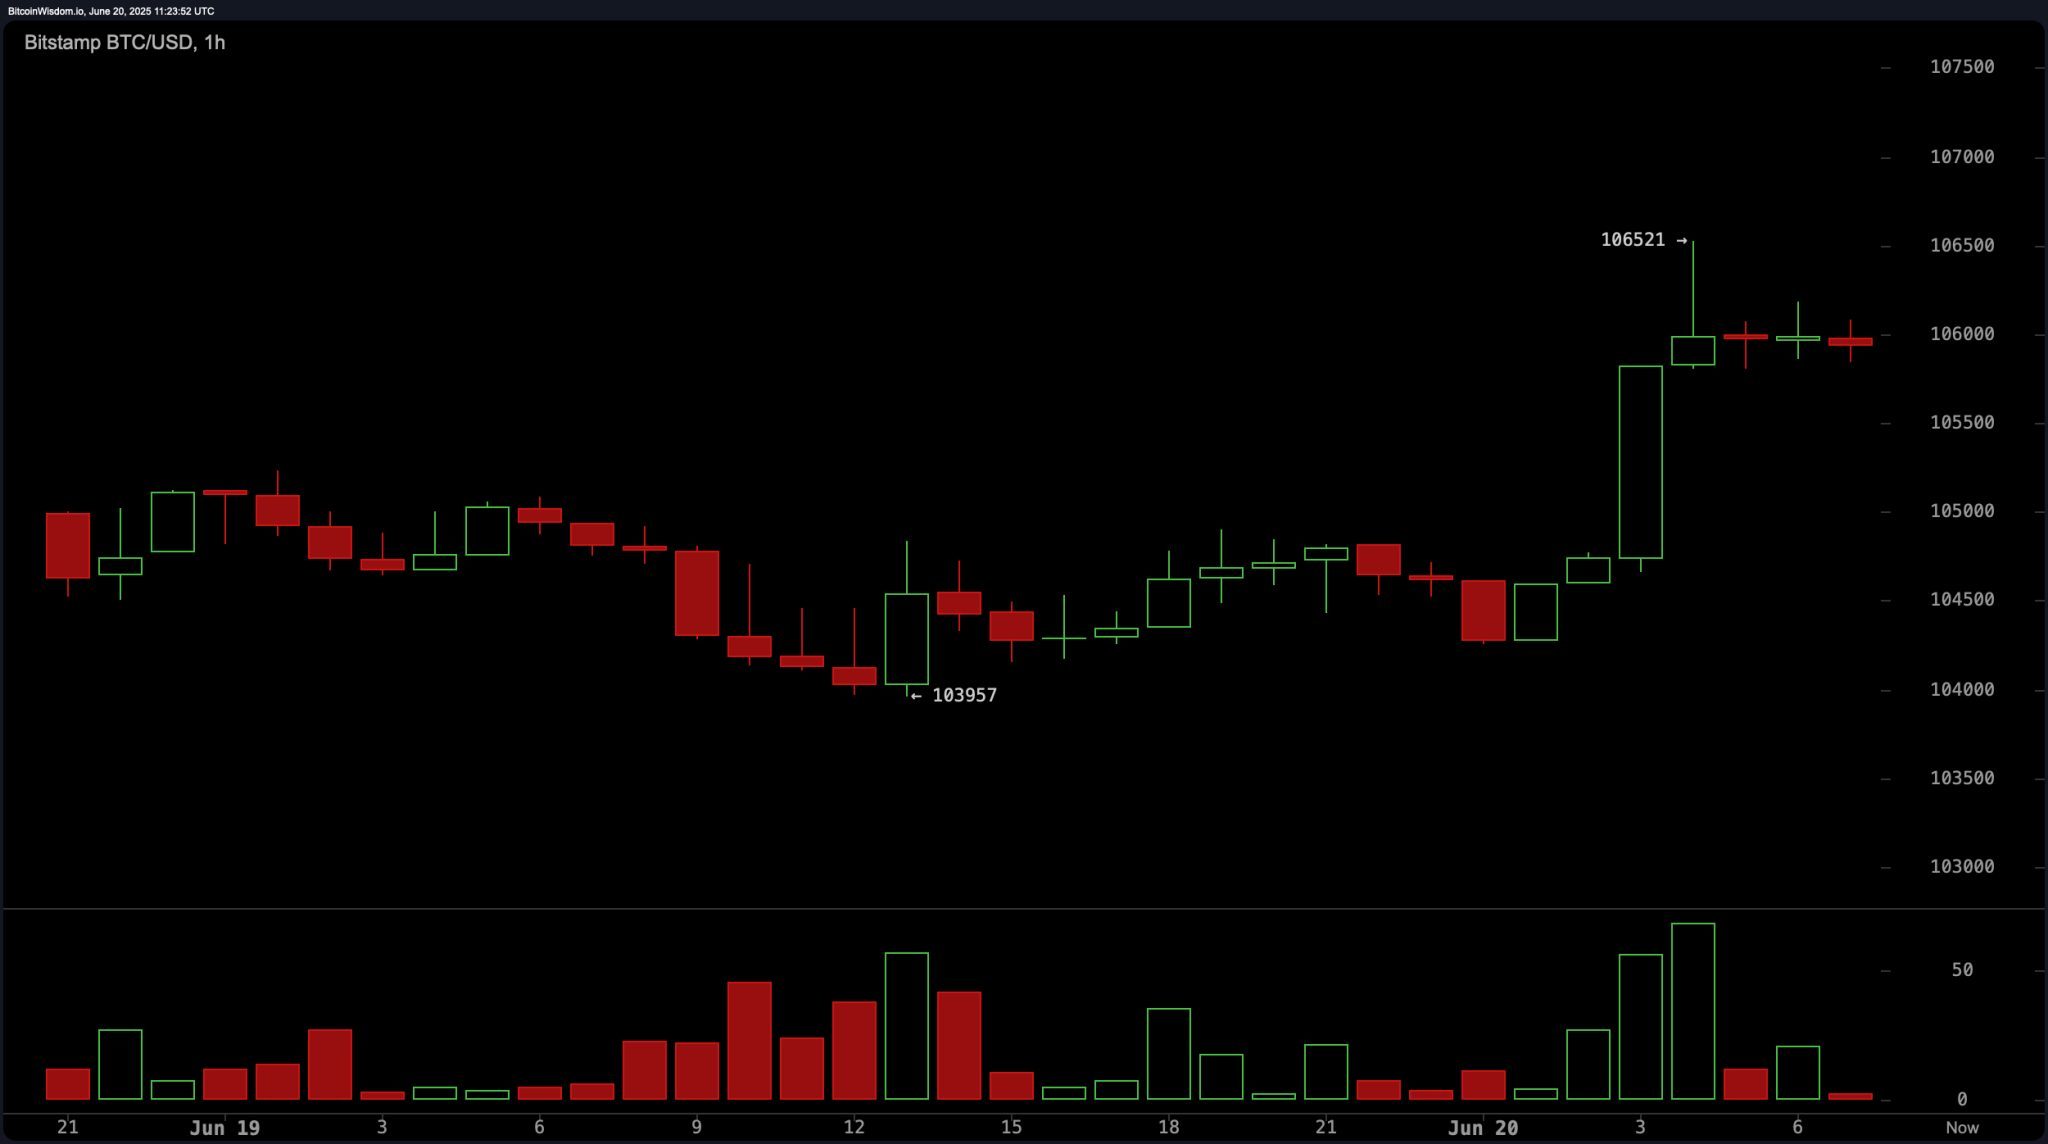
The 1-hour bitcoin chart reveals a short-term bullish breakout following the formation of a double bottom pattern at $103,957. Momentum accelerated sharply after the price pushed through $106,000, supported by a spike in green volume. Immediate resistance is noted at $106,521, the most recent high. Technical positioning favors entry on a retest above $106,000 or a clean break above $106,521. A retracement to $105,500 could offer a secondary entry opportunity.
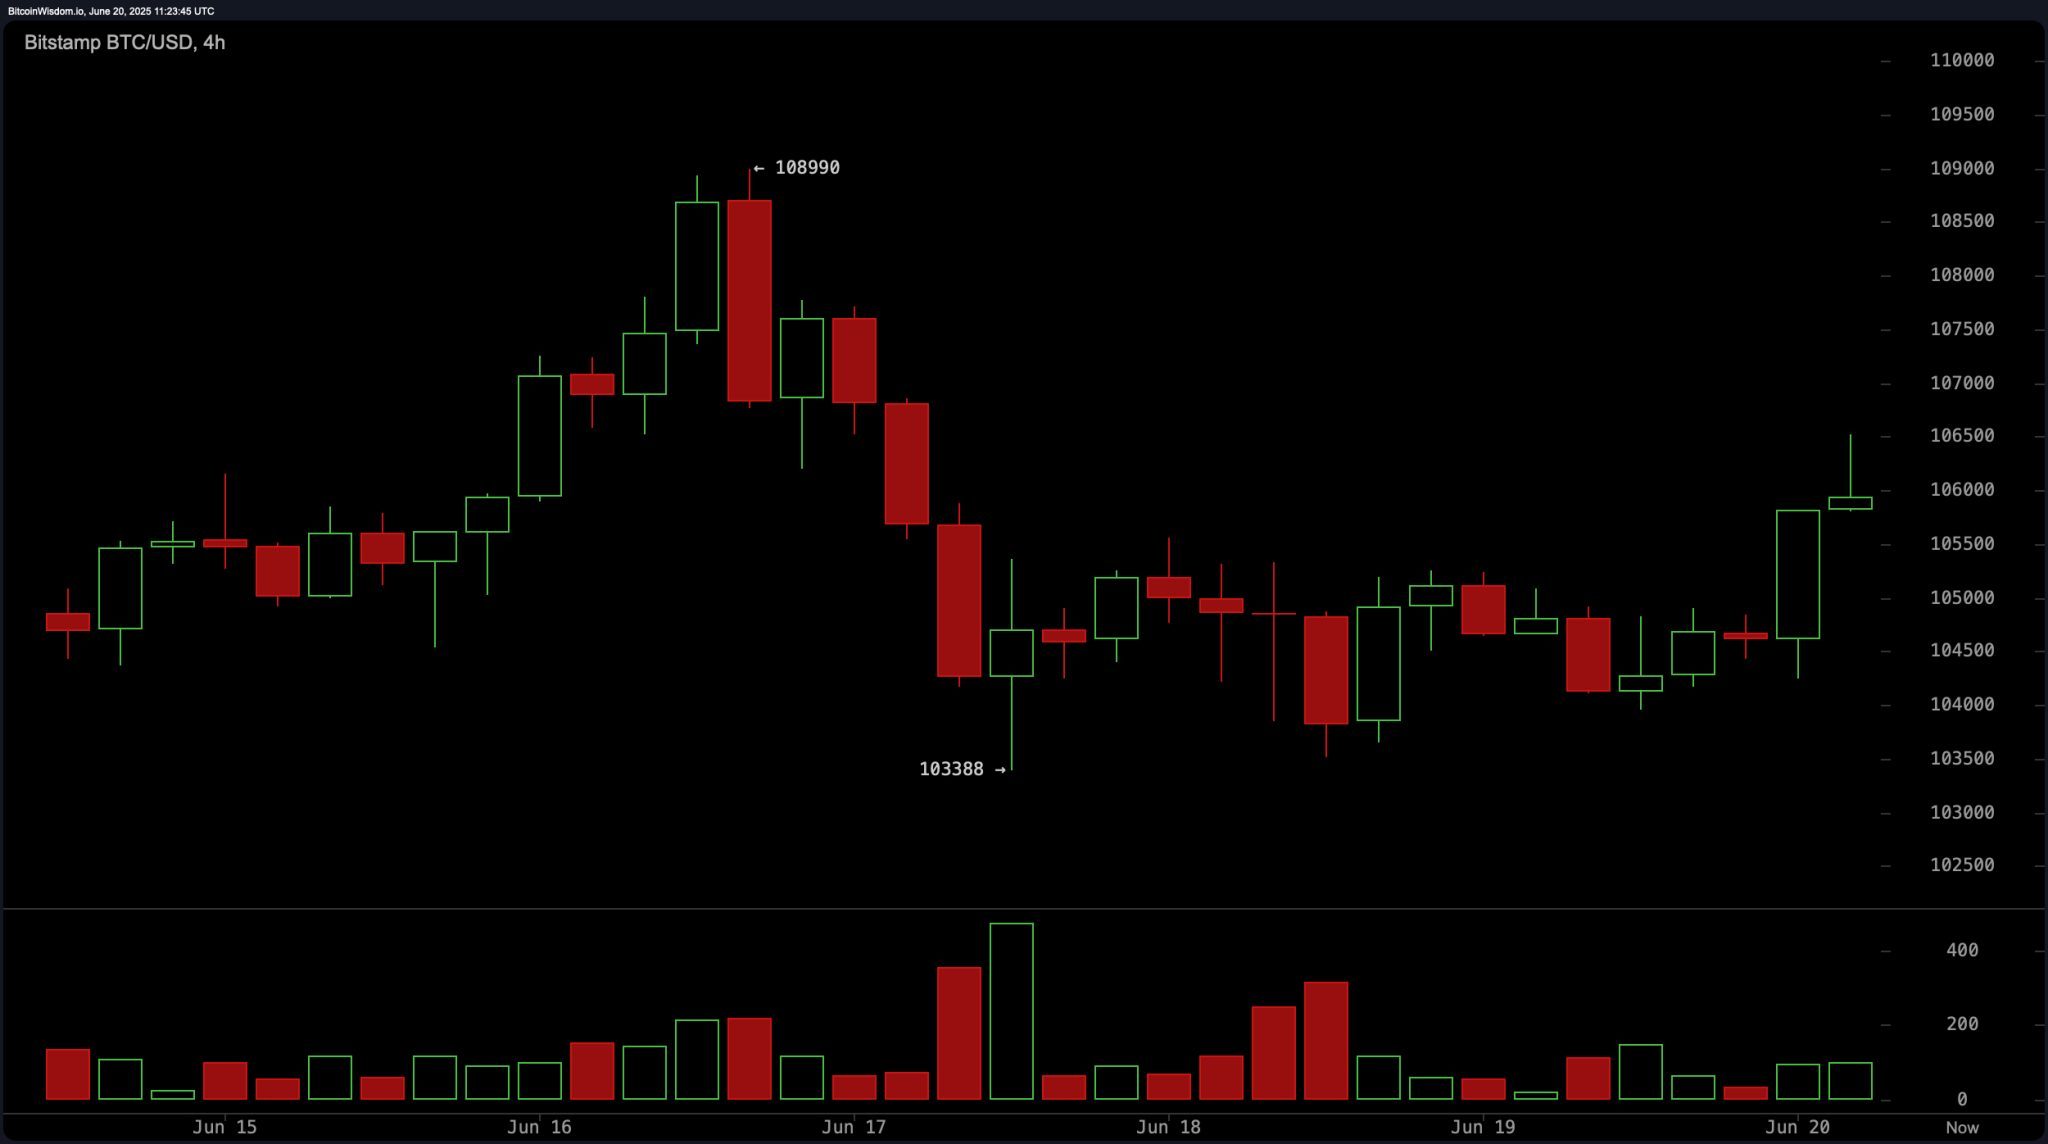
An analysis of the 4-hour bitcoin chart indicates a weak recovery phase from a recent dip to $103,388. The volume profile shows growing interest with upward candles, suggesting accumulation and building momentum. The rounded bottom structure suggests a potential shift in short-term sentiment. Buying strength is visible in the $105,500–$106,000 region, especially if $106,500 is surpassed with conviction.
On the daily BTC/USD chart, bitcoin continues to exhibit a sideways trajectory with a slight bearish tilt. Price rejection from the $112,000 zone led to a drop toward $100,426, where it recently bounced but has failed to maintain levels above $105,000 with strength. A bearish flag pattern is forming, and declining volume suggests fading momentum. Technical strategists may consider initiating positions only if a daily close occurs above $107,500, with more reliable confirmation