
On Saturday, bitcoin traded at $86,189 on March 8, 2025, with a market capitalization of $1.70 trillion and a 24-hour global trade volume of $47.62 billion, fluctuating between an intraday low of $85,109 and a high of $91,081, marking a 20.7% decline from its all-time high on Jan. 20, 2025.

Bitcoin
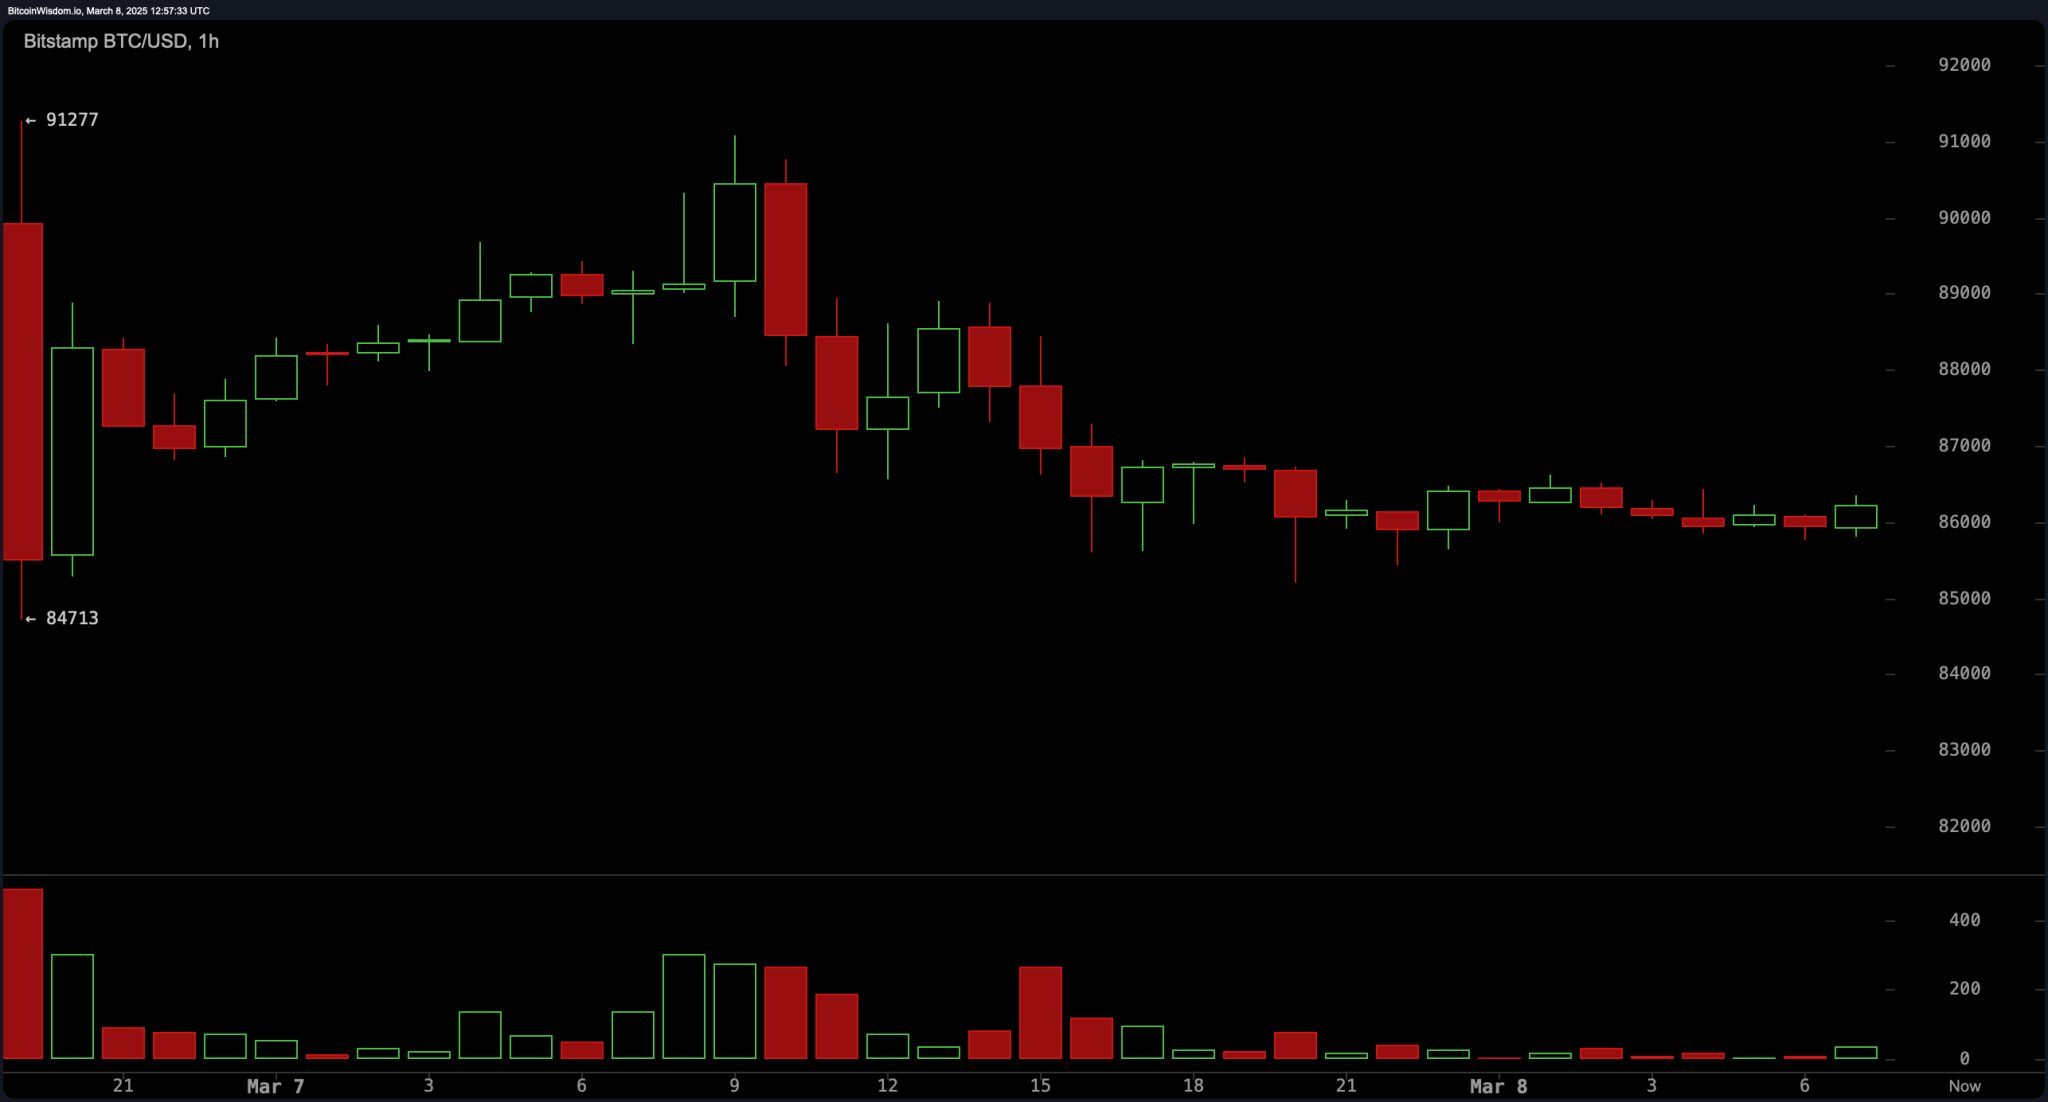
Bitcoin‘s 1-hour chart indicates a sideways price movement between $85,000 and $87,000, with declining volume suggesting a lack of strong momentum. A short-term resistance level at $88,000 presents an obstacle for further gains, while a breakdown below $84,000 could open the door for additional downside. The moving averages reinforce a bearish sentiment in the short term, as the exponential moving average (10) at $88,449 and the simple moving average (10) at $87,626 both signal a sell. However, the momentum (10) oscillator remains in buy territory, indicating the possibility of a short-term upward push.
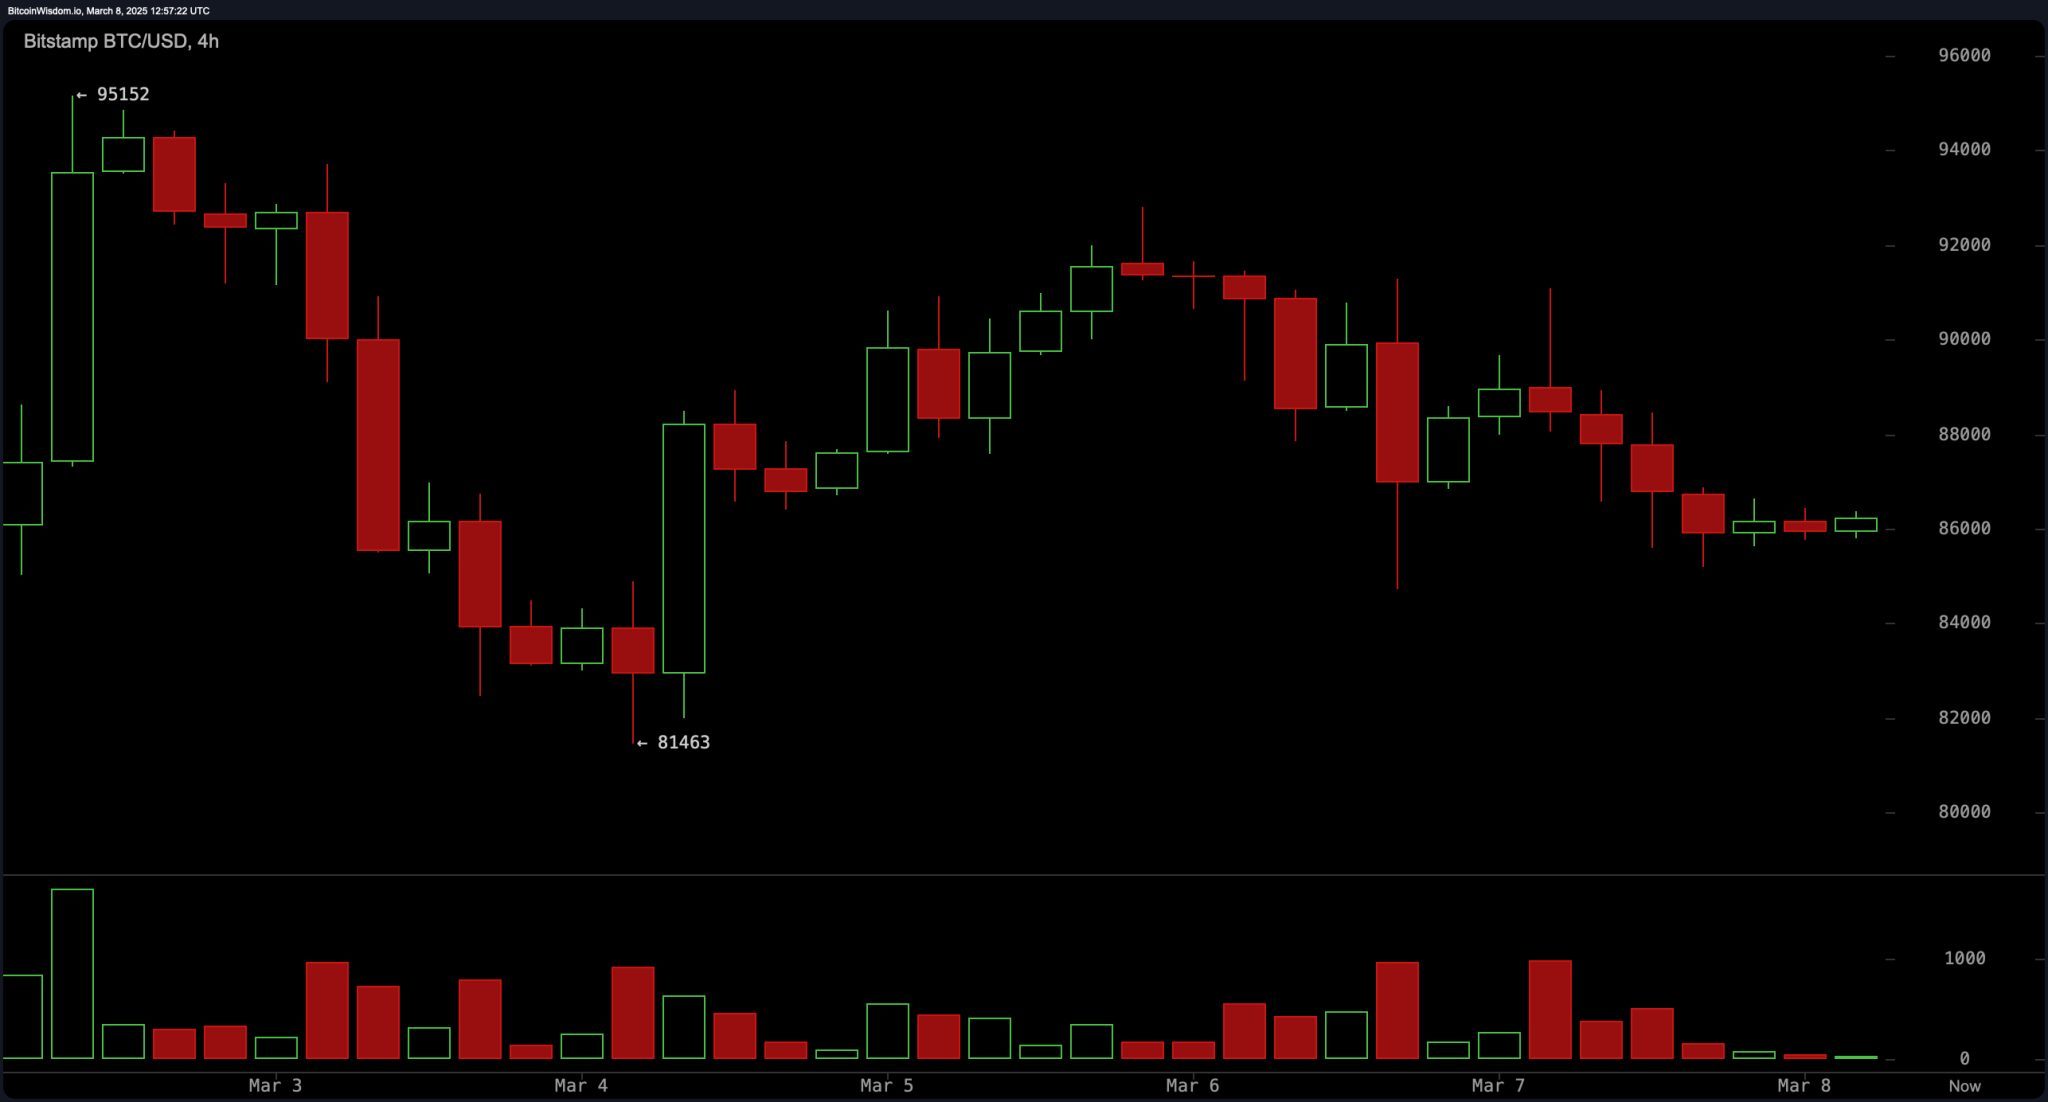
On the 4-hour chart, bitcoin has found support near $81,463, with a rebound bringing it into the $88,000-$90,000 range. The price is consolidating between $85,000 and $88,000, suggesting a tug-of-war between buyers and sellers. The failure to post higher highs raises concerns about continued weakness unless a decisive breakout occurs. The moving averages maintain a bearish stance, with all key levels from the exponential moving average (20) at $90,374 to the simple moving average (50) at $96,459 pointing to selling pressure. A break above $90,000 could lead to a bullish breakout, while a failure to sustain levels above $88,000 may trigger a retest of $81,000.
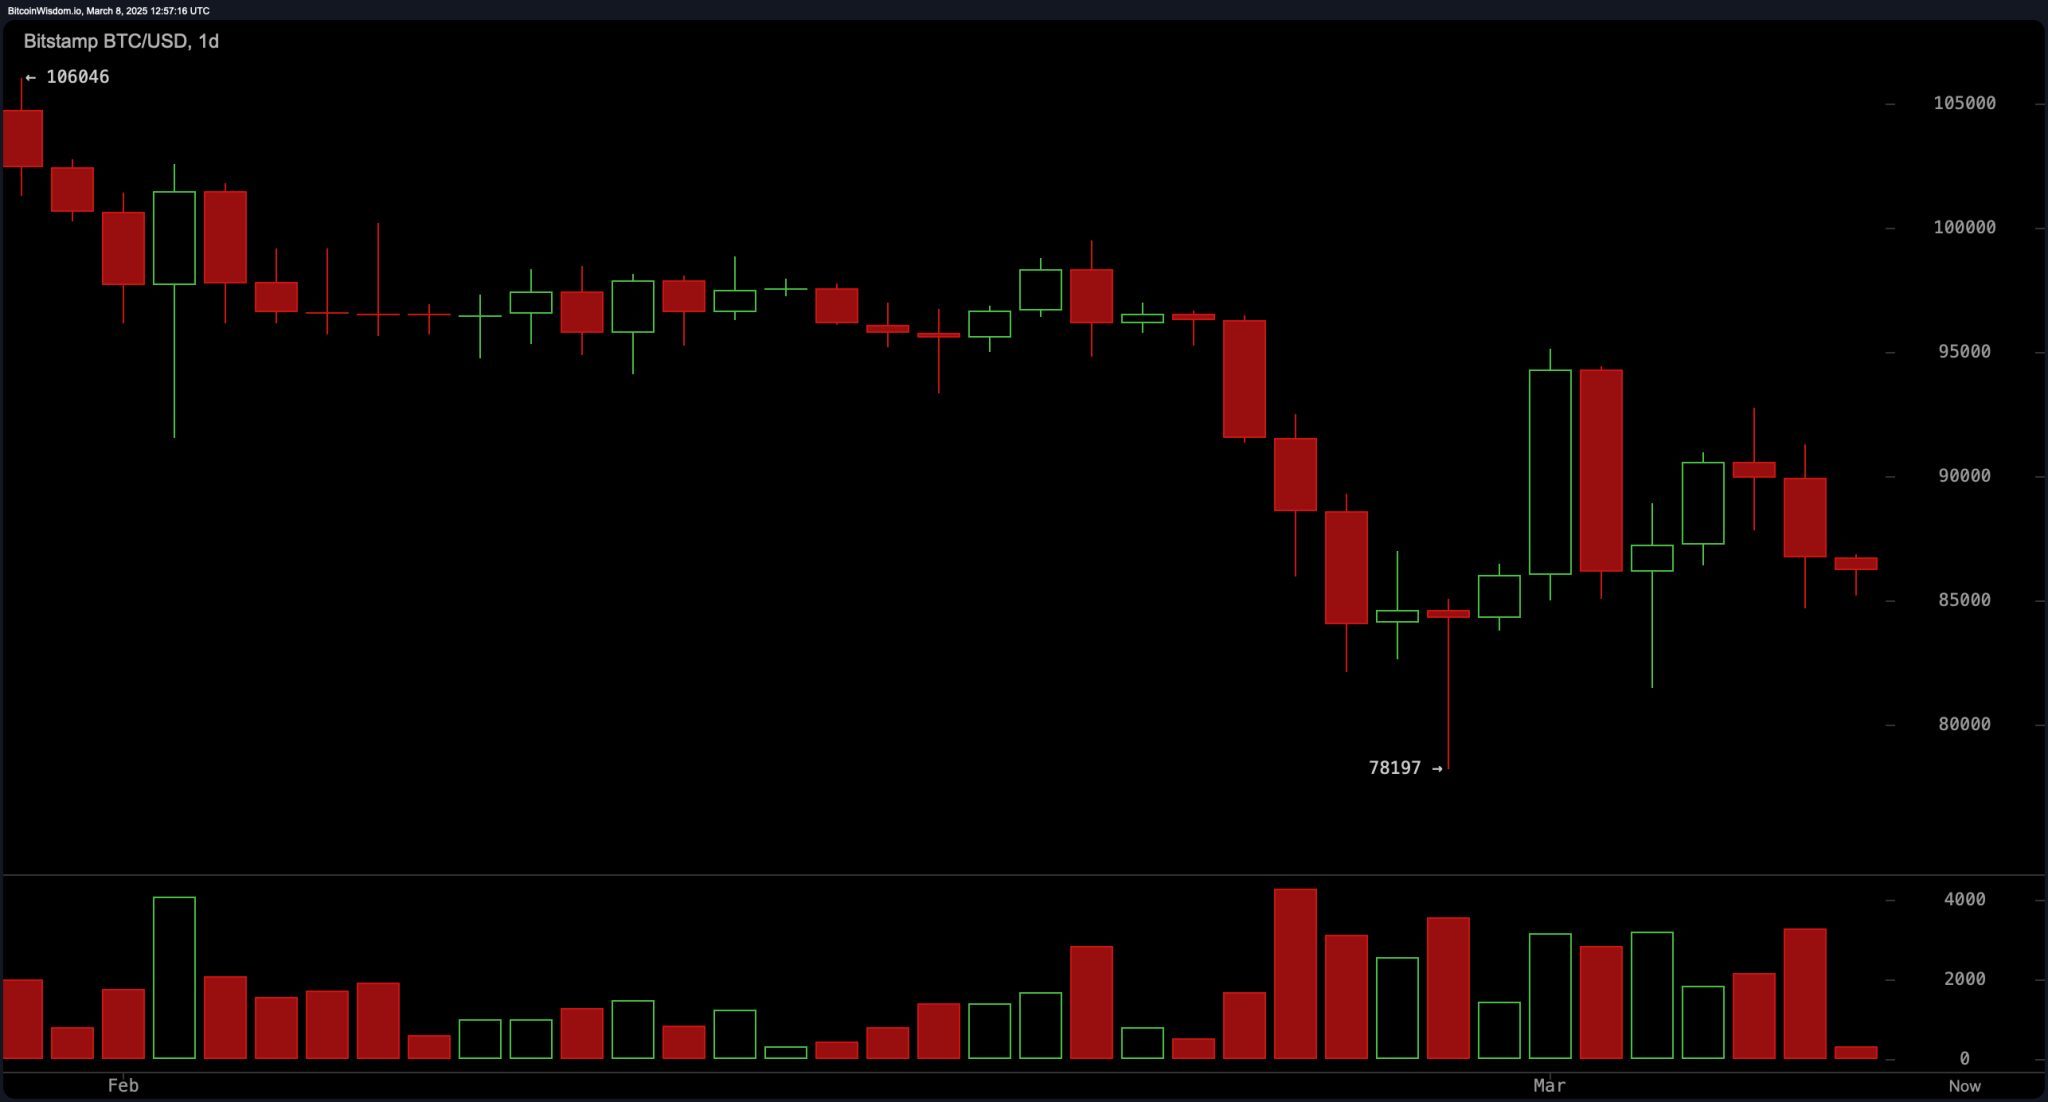
The daily chart reflects a broader downtrend, though a recent recovery attempt from $78,197 has introduced potential buying interest. Strong support exists around $78,000, while resistance at $90,000 has proven difficult to overcome. The relative strength index (RSI) sits at 41, signaling neutral momentum, while the moving average convergence divergence (MACD) level at -2,565 indicates a potential buy signal. A push above $90,000 would be needed to confirm a reversal, while a break below $78,000 could extend losses further.
The oscillators provide a mixed picture, with the commodity channel index (CCI) at -71, the awesome oscillator at -5,662, and the Stochastic at 48 all registering neutral readings. The average directional index (ADI) at 35 confirms a lack of strong trend direction. The moving averages remain predominantly bearish, with short- and mid-term averages signaling sell conditions, while the exponential moving average (200-day) at $85,836 and the simple moving average (200-day) at $83,174 offer a buy signal, suggesting long-term support remains intact.
Overall, bitcoin’s price action remains range-bound, with a potential breakout above $90,000 required to shift sentiment in favor of the bulls. Conversely, a failure to hold key support levels at $84,000 and $81,000 could extend the downward trend. Until a decisive move occurs, price action is likely to oscillate between key resistance and support zones, with traders closely watching for volume confirmation to dictate the next major move.
Bull Verdict:
If bitcoin can break and sustain a move above $90,000, bullish momentum could accelerate, pushing the price toward $95,000 and beyond. The moving average convergence divergence (MACD) level and momentum oscillator indicate a potential upward push, while the 200-period moving averages suggest long-term support remains intact. A strong breakout with increasing volume could mark the beginning of a new uptrend.
Bear Verdict:
Bitcoin’s failure to reclaim $90,000, combined with the predominance of bearish moving averages, suggests continued downside risk. If support at $84,000 and $81,000 fails to hold, a drop toward the $78,000 level—or lower—becomes increasingly likely. The market remains vulnerable to selling pressure unless a clear reversal pattern emerges with sustained buying volume.