
On Tuesday, bitcoin’s price held steady at $119,072 on July 22, 2025, buoyed by a market capitalization of $2.36 trillion and strong 24-hour trading volume of around $56.25 billion. The intraday range reflected volatility between $116,787 and $119,296, offering a dynamic setup for traders across all timeframes.

Bitcoin
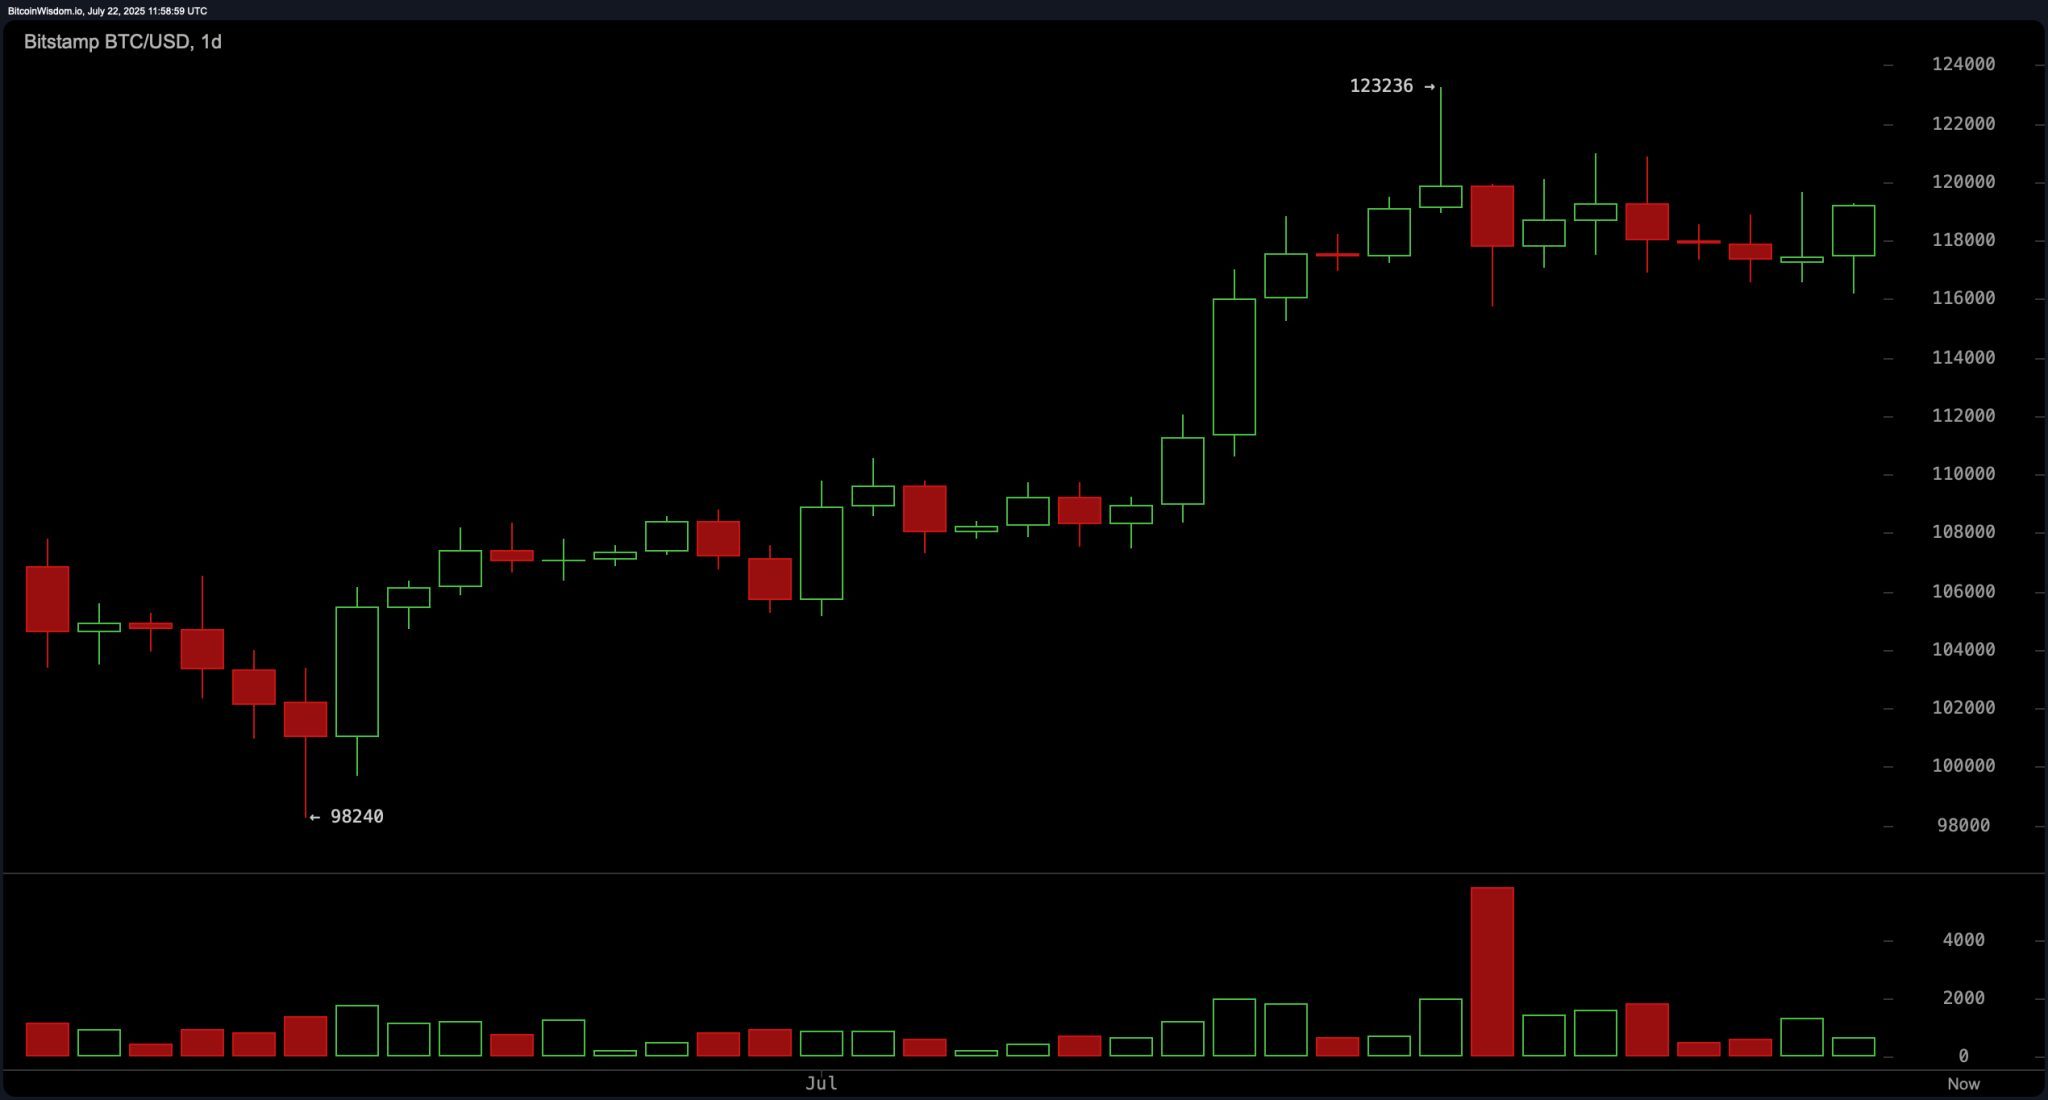
On the daily chart, bitcoin remains in a confirmed short-term uptrend, having bounced from a recent low near $98,240. Price action has since tested and respected the $116,000–$117,000 support range twice, indicating a potential double bottom formation. The resistance ceiling at $123,000, previously marked by upper wick rejection, sets the tone for the next directional move. Volume profiles reveal elevated selling pressure post-July 10, hinting at short-term distribution, yet sustained closes above the $117,000 threshold may signal strength.
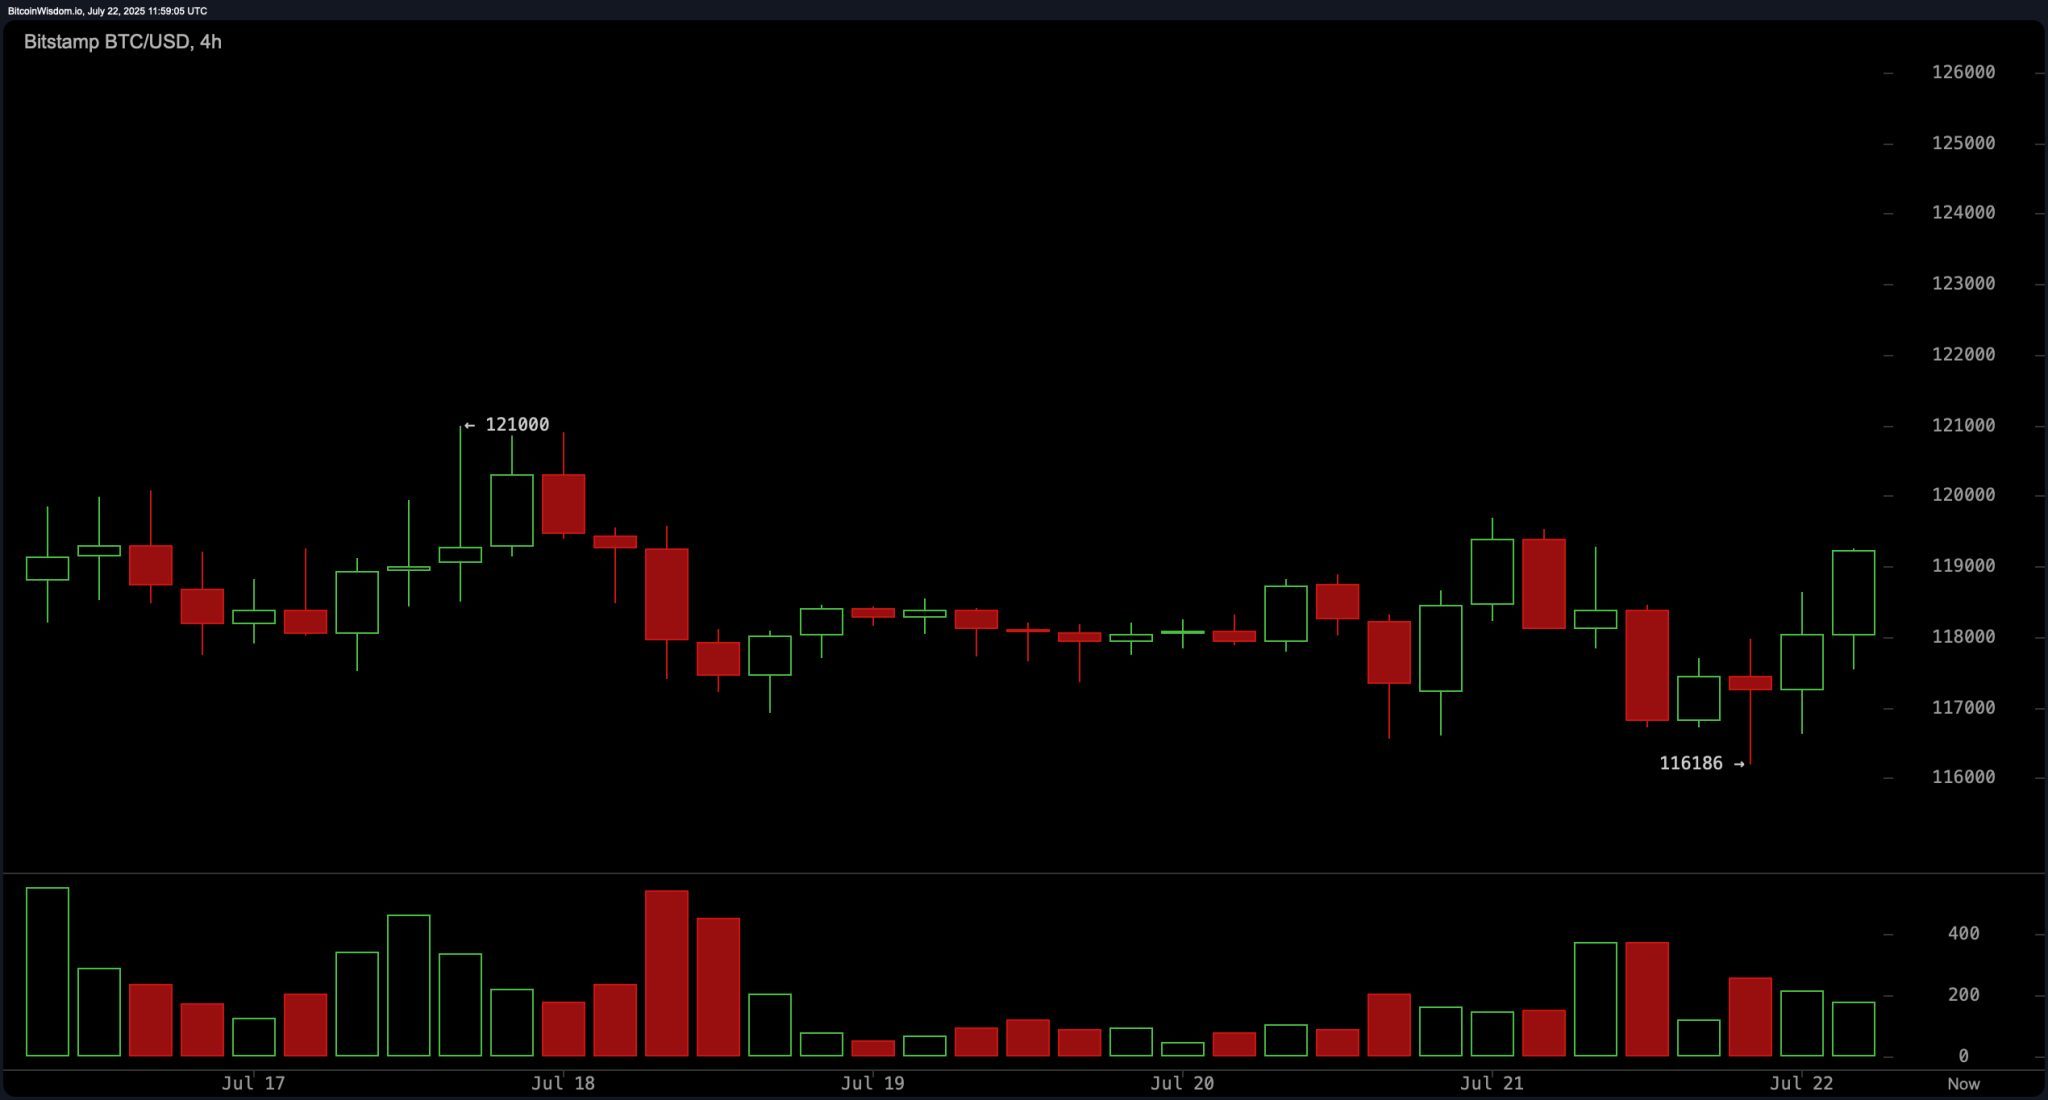
On the 4-hour BTC/USD chart, the consolidation pattern post-$121,000 high shows higher lows and modest pullbacks, suggesting underlying demand. Support is observed near $116,186, with several rebounds confirming buyers’ presence. Price is navigating within a $117,000–$117,500 accumulation zone, where entry positions may be considered, particularly on bullish volume expansion. A confirmed breakout above $119,500 would reinforce short-term bullish momentum.
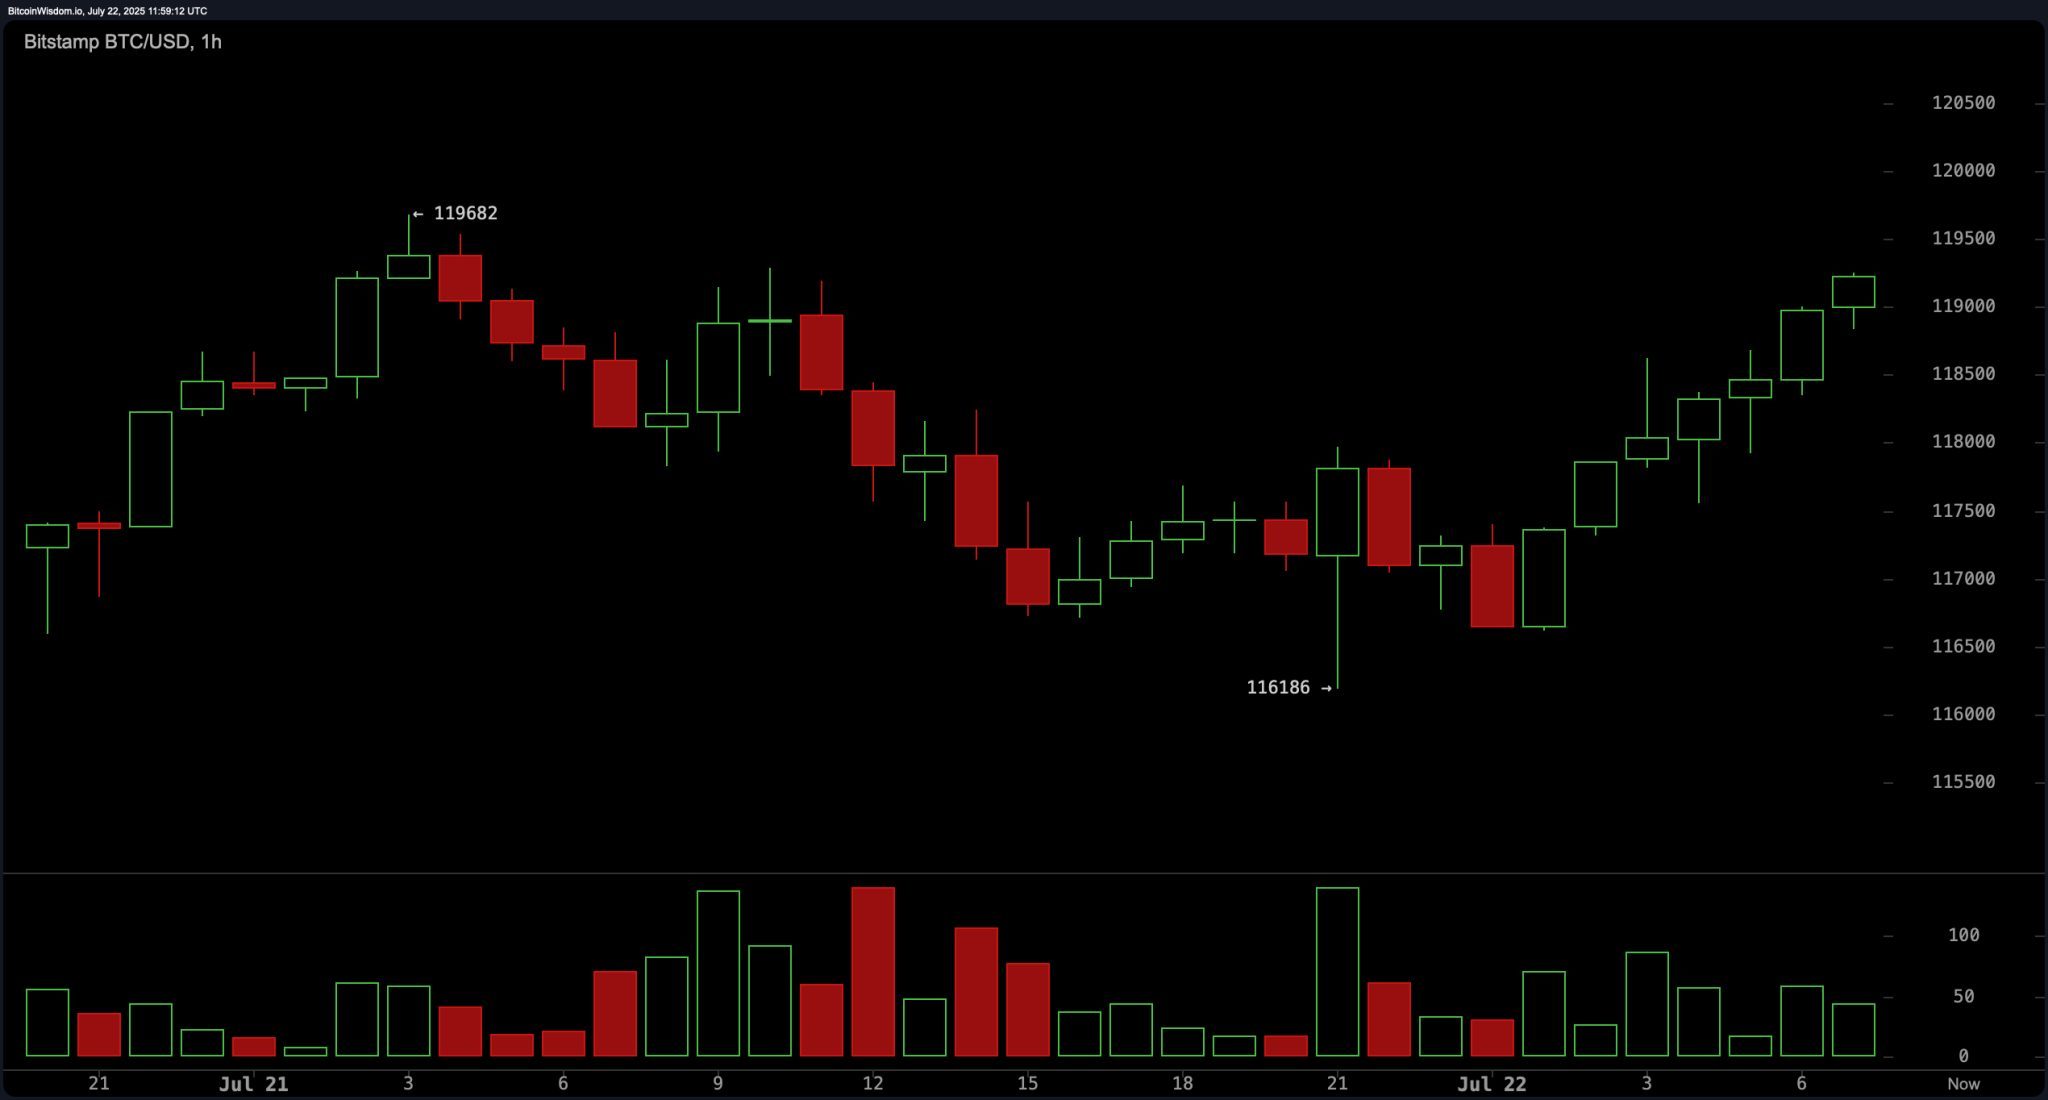
The 1-hour BTC/USD chart reinforces the bullish intraday narrative. bitcoin exhibited strong recovery behavior from the $116,186 mark, forming a clear structure of higher highs and higher lows. Notably, volume increased on bullish candles, indicating genuine buying interest. Traders may look for momentum-driven entries if price maintains levels above $119,000, especially if it consolidates or breaks out around the $119,500 level.
Oscillator readings present a neutral overall outlook, though momentum indicators reflect underlying bullish pressure. The relative strength index (RSI) stands at 67, remaining just below overbought territory. Both the Stochastic and the commodity channel index (CCI) indicate neutrality at 66 and 54, respectively. The average directional index (ADX) reads 28, denoting a non-trending but strengthening environment. Momentum (10) is a bullish outlier at 1,748, while the moving average convergence divergence (MACD) level at 2,902 signals a negative trend, suggesting caution at elevated price zones.
From a trend-following standpoint, all major moving averages (MAs) continue to support a bullish bias. The exponential moving averages (EMA) and simple moving averages (SMA) across 10-, 20-, 30-, 50-, 100-, and 200-periods all issue bullish signals, with the EMA (10) at $117,530 and the SMA (10) at $118,470, both above current price levels. Long-term EMAs such as the EMA (200) at $98,540 further cement the broader bullish structure. While momentum remains favorable, traders are advised to watch for volume divergence and apply disciplined risk management as bitcoin approaches resistance territory.
Bull Verdict:
Bitcoin remains structurally bullish across all major timeframes, supported by consistently higher lows, strong buying volume, and unanimous confirmation from short- to long-term moving averages. A sustained break above $119,500 with volume could pave the way toward the $123,000 resistance zone, reinforcing upward momentum for short-term and swing traders alike.
Bear Verdict:
Despite prevailing uptrend signals, caution is warranted as key oscillators reflect neutral to overbought conditions and the moving average convergence divergence (MACD) issues a sell signal. Failure to maintain support above $117,000 or a rejection below $119,500 may invite downside pressure, with increased risk of pullback toward $115,500 if momentum fades.