
Bitcoin is trading at $104,589 with a 24-hour trading volume of $42.32 billion, a market capitalization of $2.07 trillion, and an intraday price range of $104,133 to $107,006, signaling consolidation after a strong rally.

Bitcoin
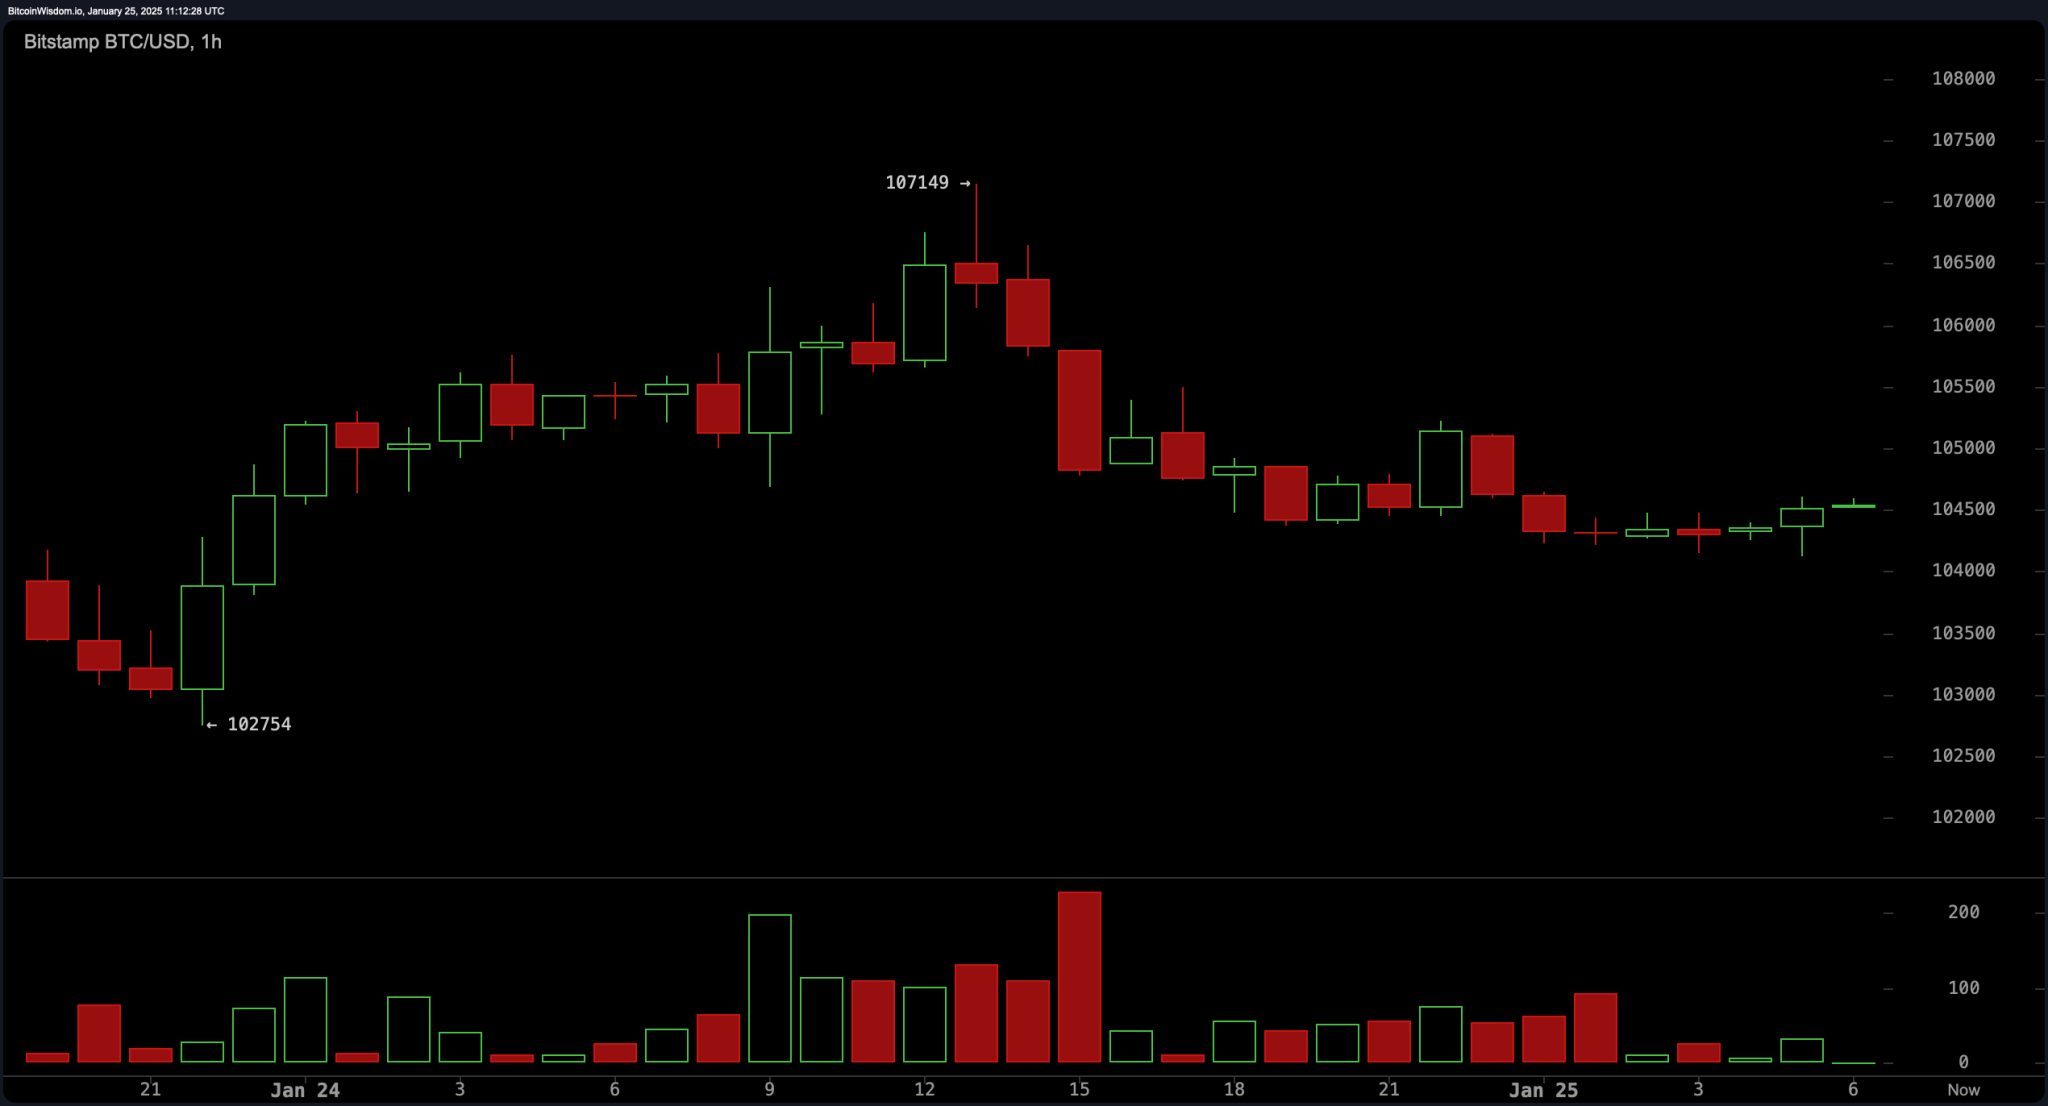
The hourly chart shows bitcoin (BTC) fluctuating between $104,000 and $106,000, with fading momentum following a rejection near $107,149. Support levels are holding at $103,000 to $104,000, while resistance remains capped at $106,500 to $107,000. Trading volume has decreased significantly, suggesting indecision or a pause ahead of a potential catalyst. Intraday traders may find opportunities to buy near $104,000 with a target of $106,500, employing a stop-loss at $103,000 to minimize downside risks. A breakout above $107,000 could open the door for a more substantial move higher.
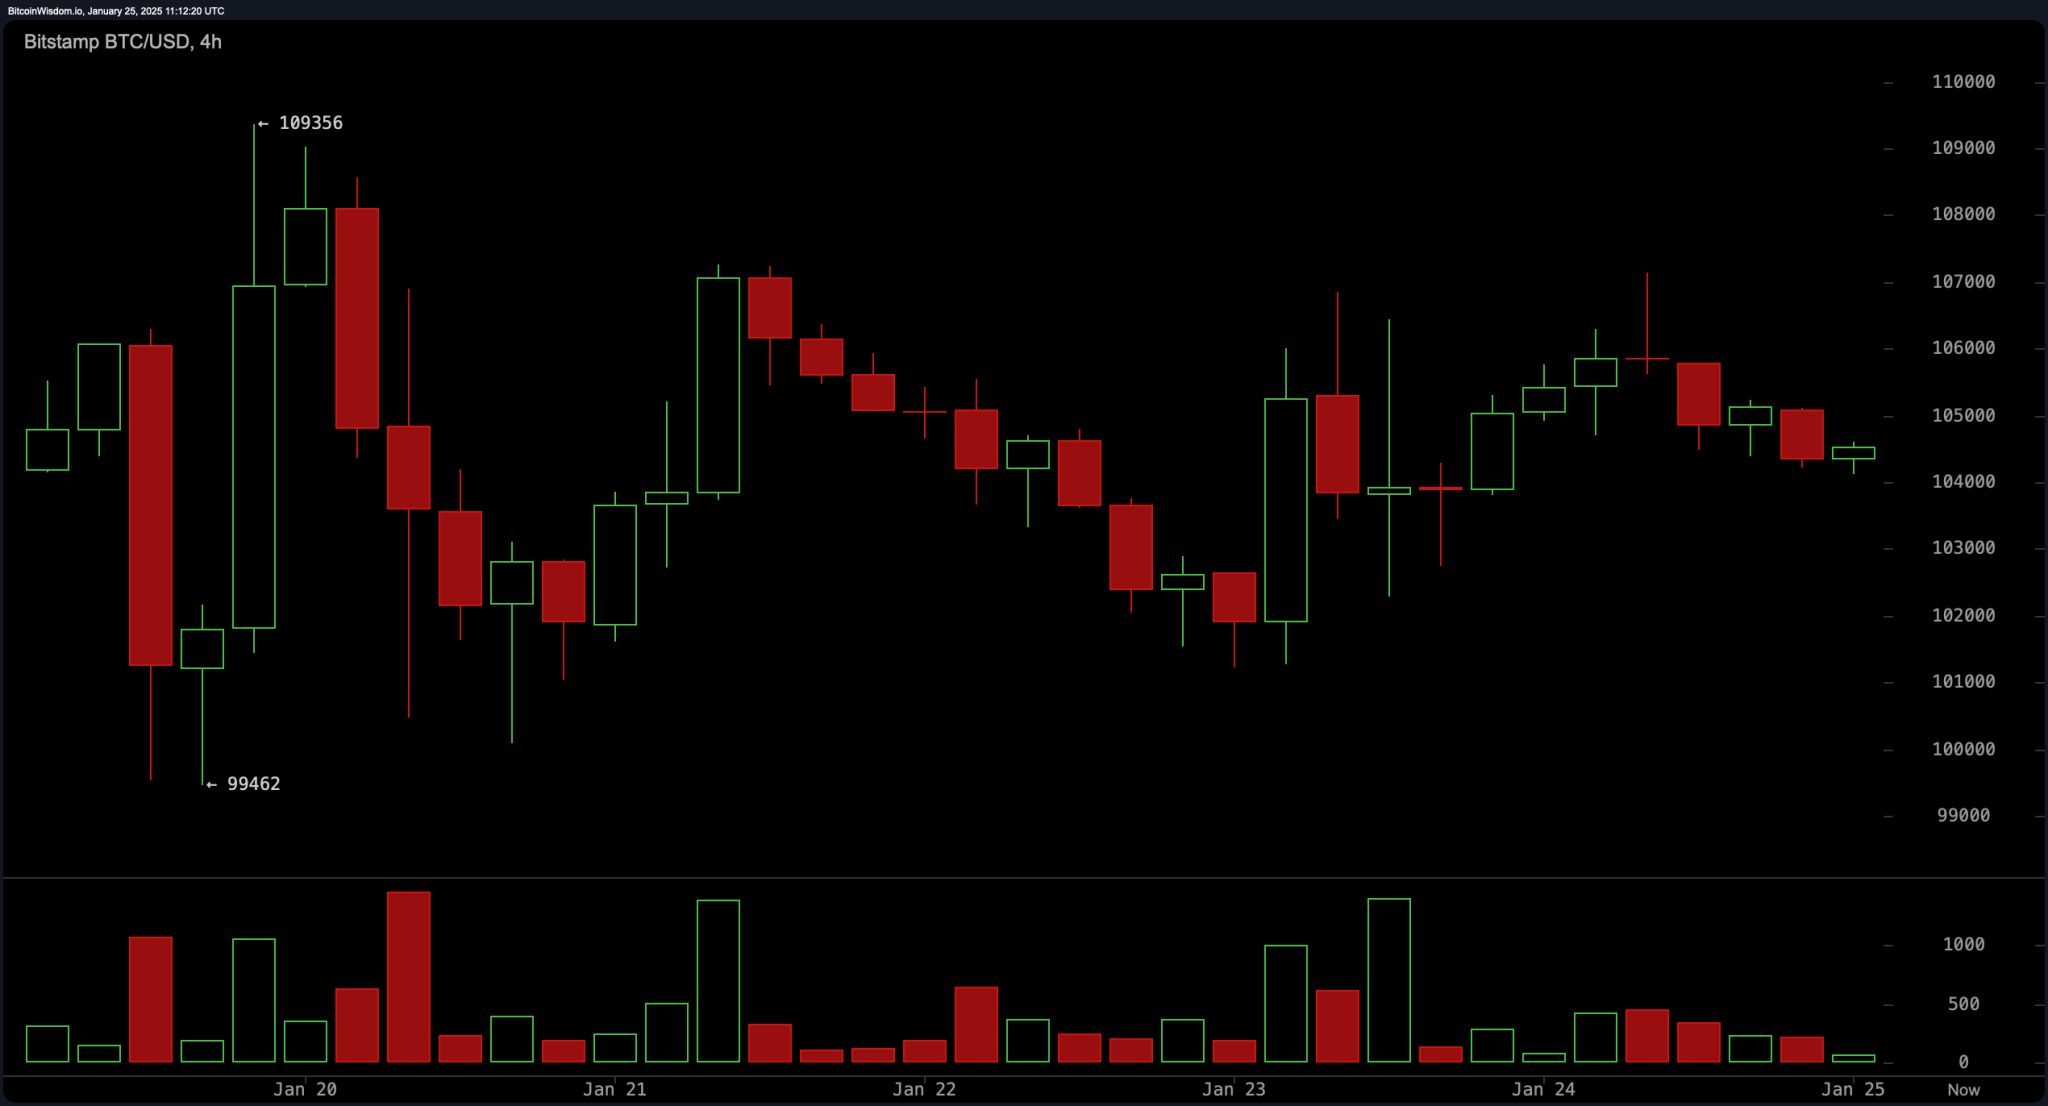
The 4-hour chart depicts range-bound activity between $104,000 and $109,000, with declining momentum on pullbacks. Support at $104,000 offers short-term buying opportunities, while resistance at $107,000 and $109,000 may trigger selling unless there is a breakout above $110,000. Volume analysis highlights a lack of strength in the retracement phase, and traders should approach resistance zones cautiously, employing strict stop-loss strategies to mitigate risks.
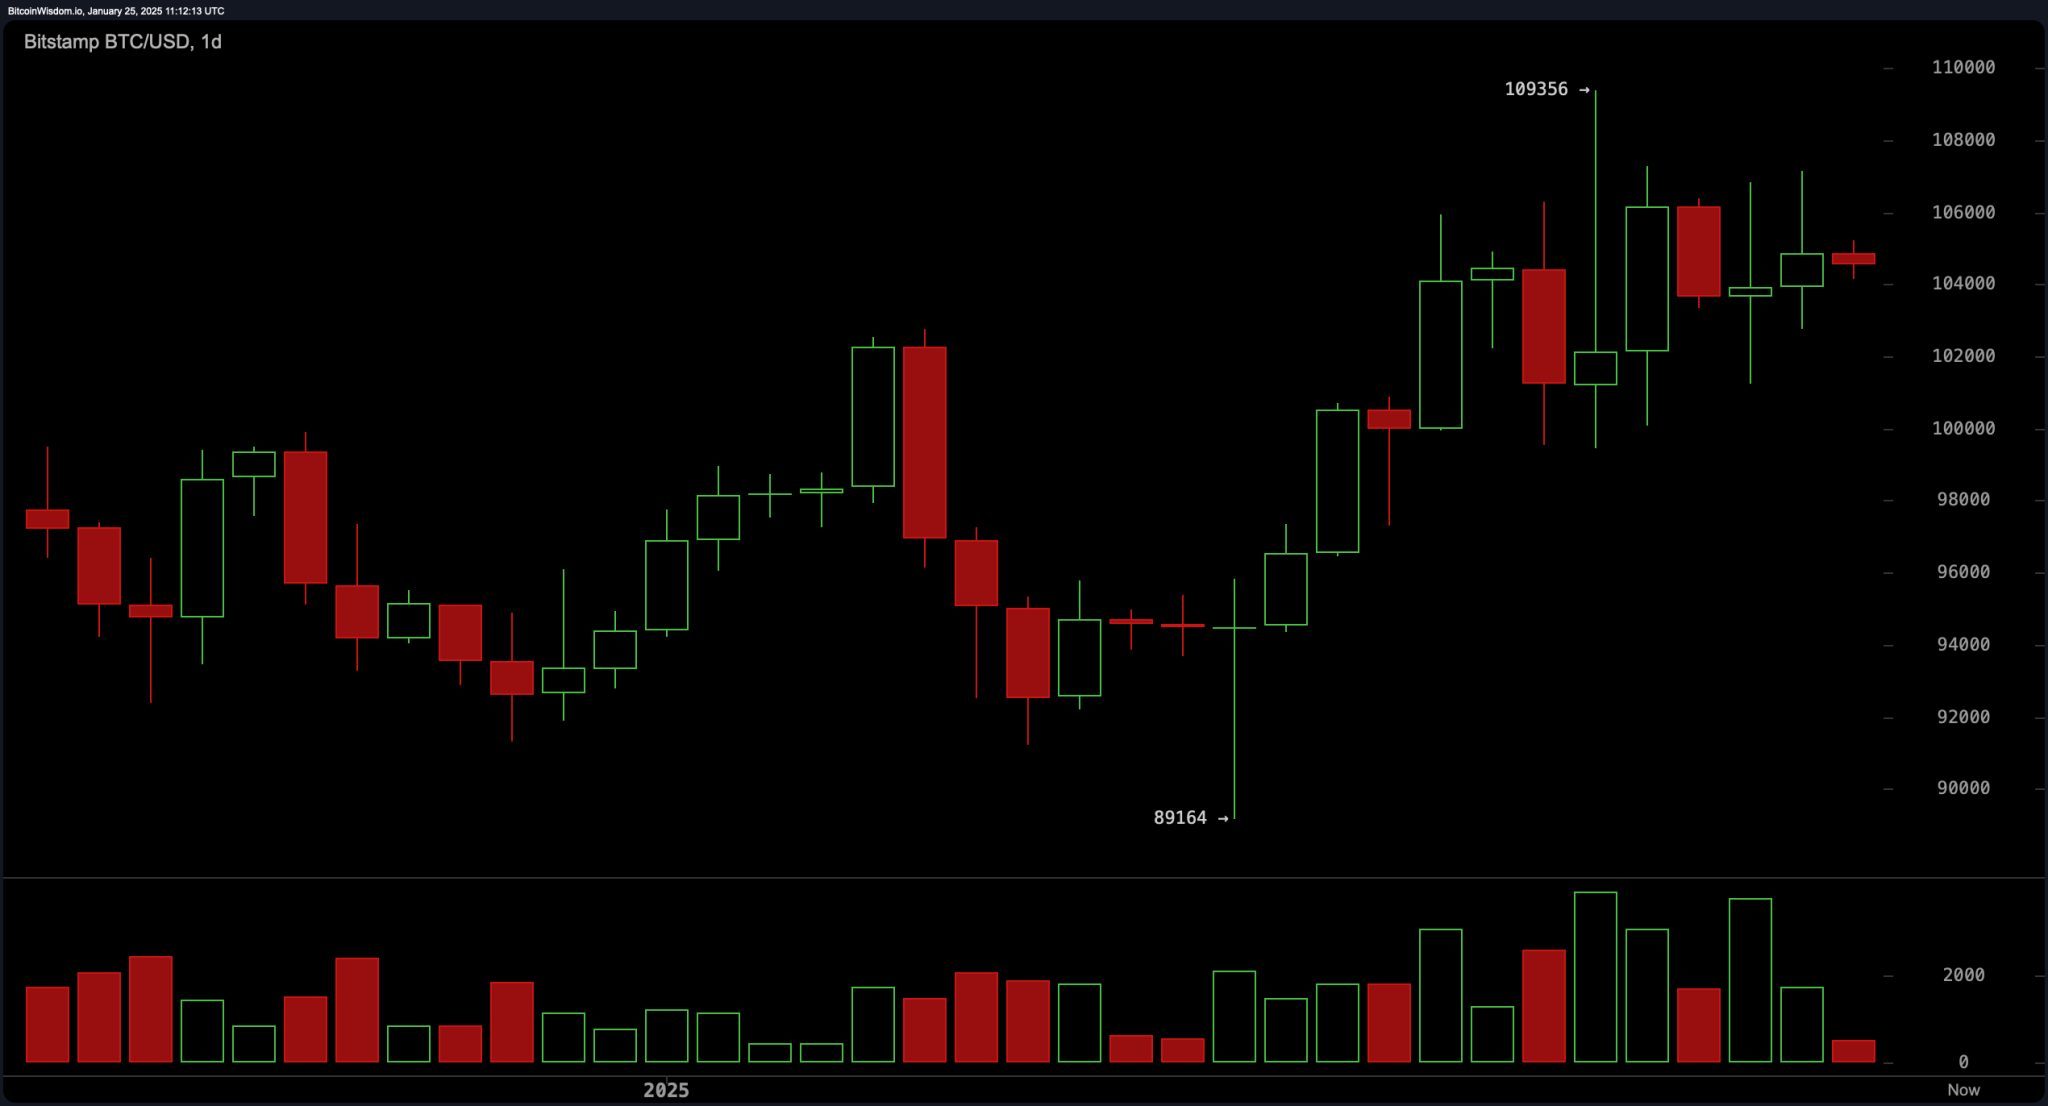
The daily chart underscores bitcoin’s broader uptrend, which has seen a rally from $89,164 to $109,356, followed by consolidation. Key support lies in the $98,000 to $100,000 range, while resistance is clustered between $109,000 and $110,000. Volume has tapered off, indicating weakening momentum, but the larger trend remains intact. Swing traders may consider entering near support levels, targeting resistance areas for profit-taking, while using stop-losses below $98,000 to manage risk.
Oscillators reflect mixed sentiment, with the relative strength index (RSI) at 60 and the Stochastic at 76 both neutral, while the momentum oscillator signals a sell at 4,023. The moving average convergence divergence (MACD) indicates a buy at 2,169, aligning with the strong buy signals from exponential moving averages (EMA) and simple moving averages (SMA) across all timeframes. Bitcoin’s price is trading significantly above its 10-period to 200-period moving averages, emphasizing bullish momentum in the broader trend.
Bull Verdict:
Bitcoin’s strong support levels, bullish signals from exponential moving averages (EMA) and simple moving averages (SMA), and a recent uptrend from $89,164 to $109,356 suggest that the broader market sentiment remains optimistic. A decisive breakout above $109,000 with strong volume could propel bitcoin toward $115,000, reinforcing a bullish outlook.
Bear Verdict:
The lack of volume during the consolidation phase, coupled with neutral oscillator readings and fading momentum, raises concerns about the sustainability of bitcoin’s rally. If support at $104,000 breaks, the price could retest $100,000 or lower, potentially marking the start of a broader corrective phase. Traders should remain cautious if resistance at $107,000 and $109,000 continues to hold.