x


Bitcoin is trading at prices between $62,856 to $63,016 at press time, with a market cap of $1.24 trillion and a 24-hour trade volume of $23.87 billion. Intraday, prices fluctuated between $62,120 and $63,909, showing signs of consolidation. Despite the overall uptrend, oscillators and moving averages paint a mixed picture, hinting at potential corrections while signaling key levels to watch for continued momentum.
On the 1-hour chart, bitcoin (BTC) rallied from $61,816 to a high of $63,975 but is now consolidating below $63,500. Moving averages remain bullish, with the 10-period exponential moving average (EMA) at $62,575 and the 10-period simple moving average (SMA) at $62,700 signaling upward momentum. However, oscillators such as the relative strength index (RSI) at 55 show neutrality, indicating neither overbought nor oversold conditions.
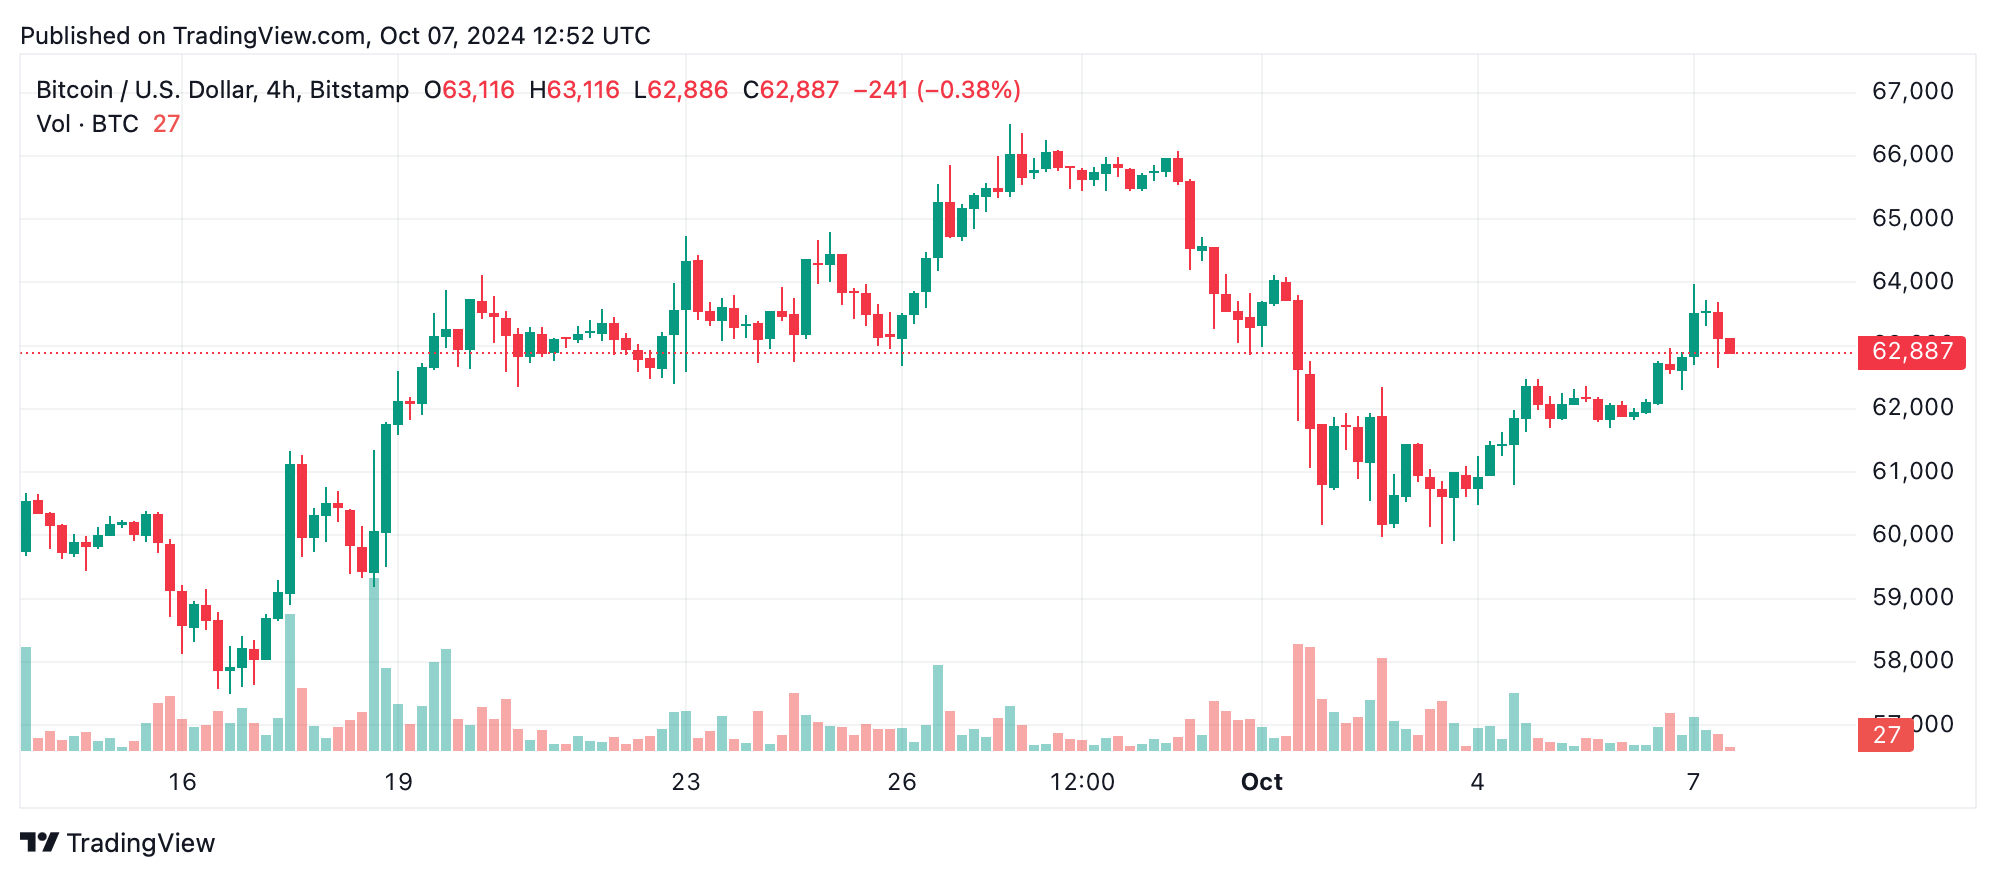
The 4-hour chart reflects a broader uptrend that began at $59,860 on Oct. 3, peaking at $63,975. The EMA and SMA indicators continue to support bullish sentiment, with the 50-period EMA at $61,502 and 50-period SMA at $60,686, both pointing to buying conditions. However, momentum oscillators like the moving average convergence divergence (MACD) level at 516 and the awesome oscillator show bearish divergence, suggesting a possible slowdown.
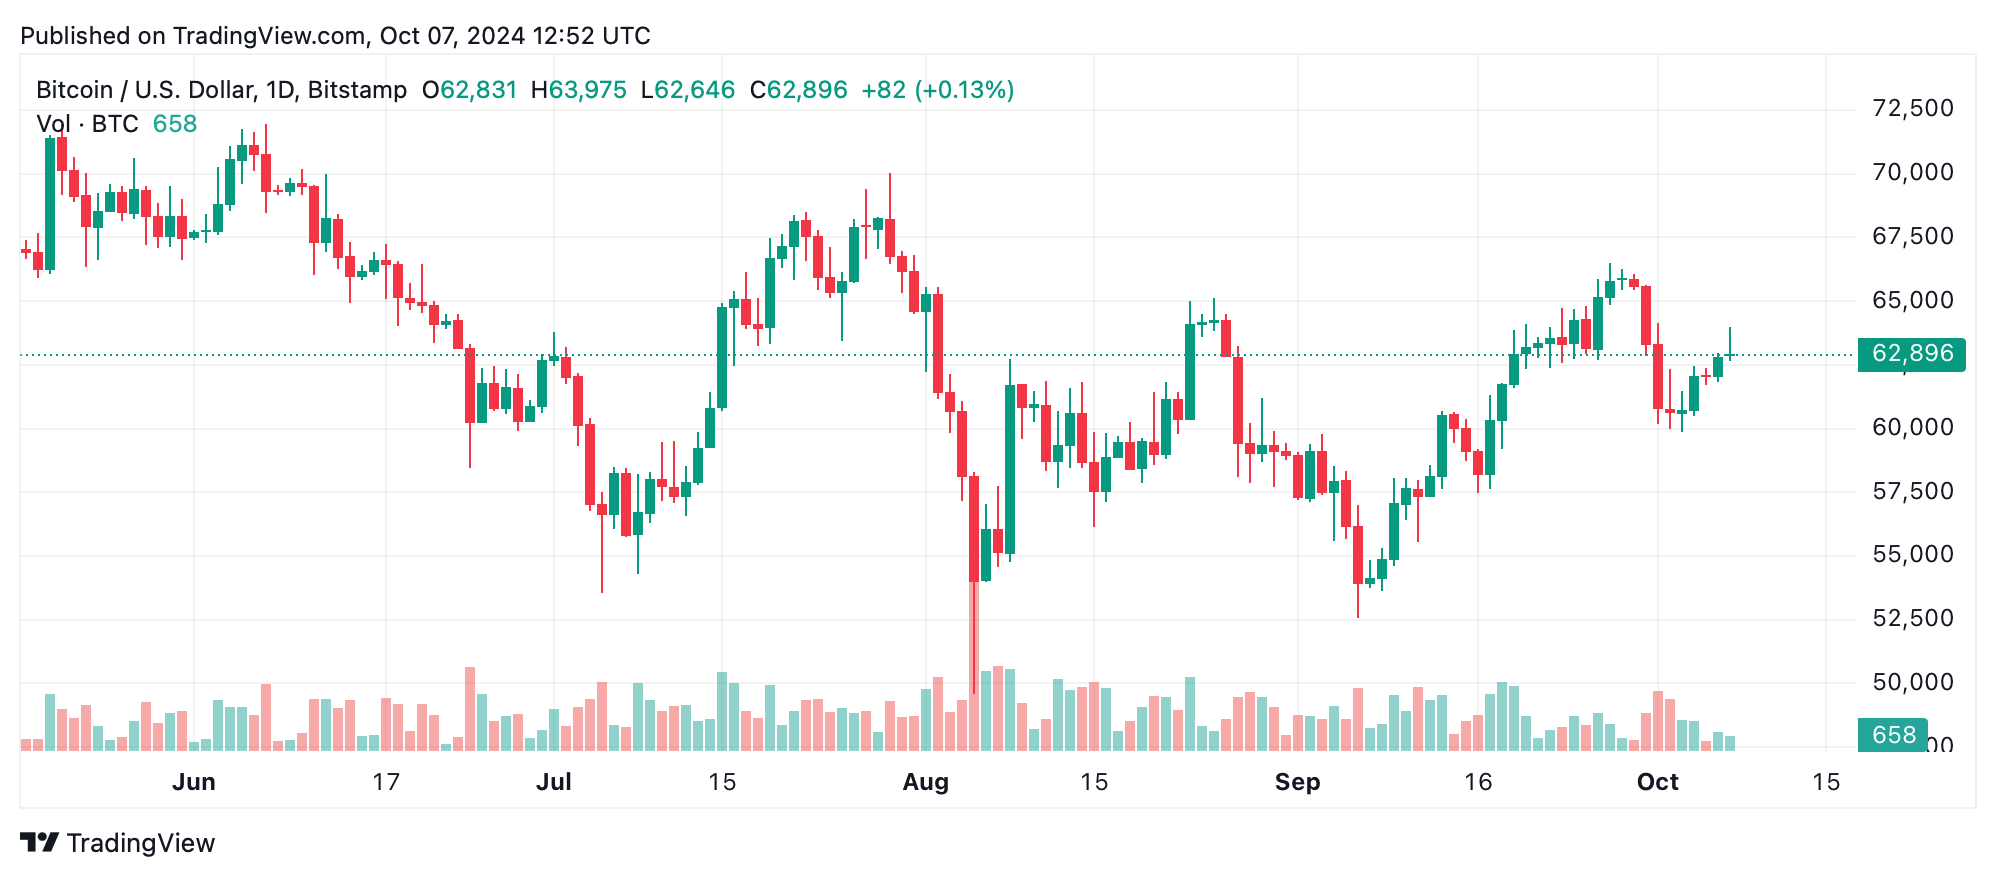
The daily chart highlights bitcoin’s longer-term uptrend, which began with a bounce from $52,546 in early October. The 100-period EMA at $61,524 and SMA at $61,097 reinforce bullish conditions, but the 200-period SMA at $63,549 signals resistance ahead. Oscillators are mixed, with the commodity channel index (CCI) at 4 remaining neutral and the momentum indicator at -2,702 suggesting a loss in bullish strength. A pullback to the $60,500-$61,500 zone could provide a better entry.
Bitcoin’s overall uptrend remains intact, supported by bullish signals from moving averages across multiple timeframes. The 1-hour and 4-hour charts suggest strong momentum, with key support holding at $63,000 and potential for further upside toward $64,000-$66,000. As long as buyers maintain control and volume picks up, a breakout above recent highs could drive bitcoin to new resistance levels. The long-term trend still favors the bulls.
Despite the upward momentum, oscillators such as the MACD and momentum indicators are showing signs of weakness, suggesting a potential slowdown or short-term correction. With key resistance near $63,549 on the daily chart and diminishing volume, the risk of a pullback to $61,000 or lower is rising. Bears may take advantage of these signals, especially if bitcoin fails to break through current resistance levels.