x






On September 2, 2024, ethereum was priced at $2,517, with a 24-hour intraday range of $2,407 to $2,531. Over the past week, its price fluctuated between $2,409 and $2,740, reflecting ongoing volatility. With a 24-hour trading volume of $14 billion and a market capitalization of $302.85 billion, ether’s market dynamics remain under pressure as it consolidates within a broader downtrend.
Ethereum’s recent price action, as analyzed across the 1-hour, 4-hour, and daily charts, indicates a persistent downtrend that began in late July. The daily chart reveals a steady decline followed by consolidation in the $2,500 to $2,600 range. Notably, trading volume has decreased, suggesting a lack of strong buying interest.
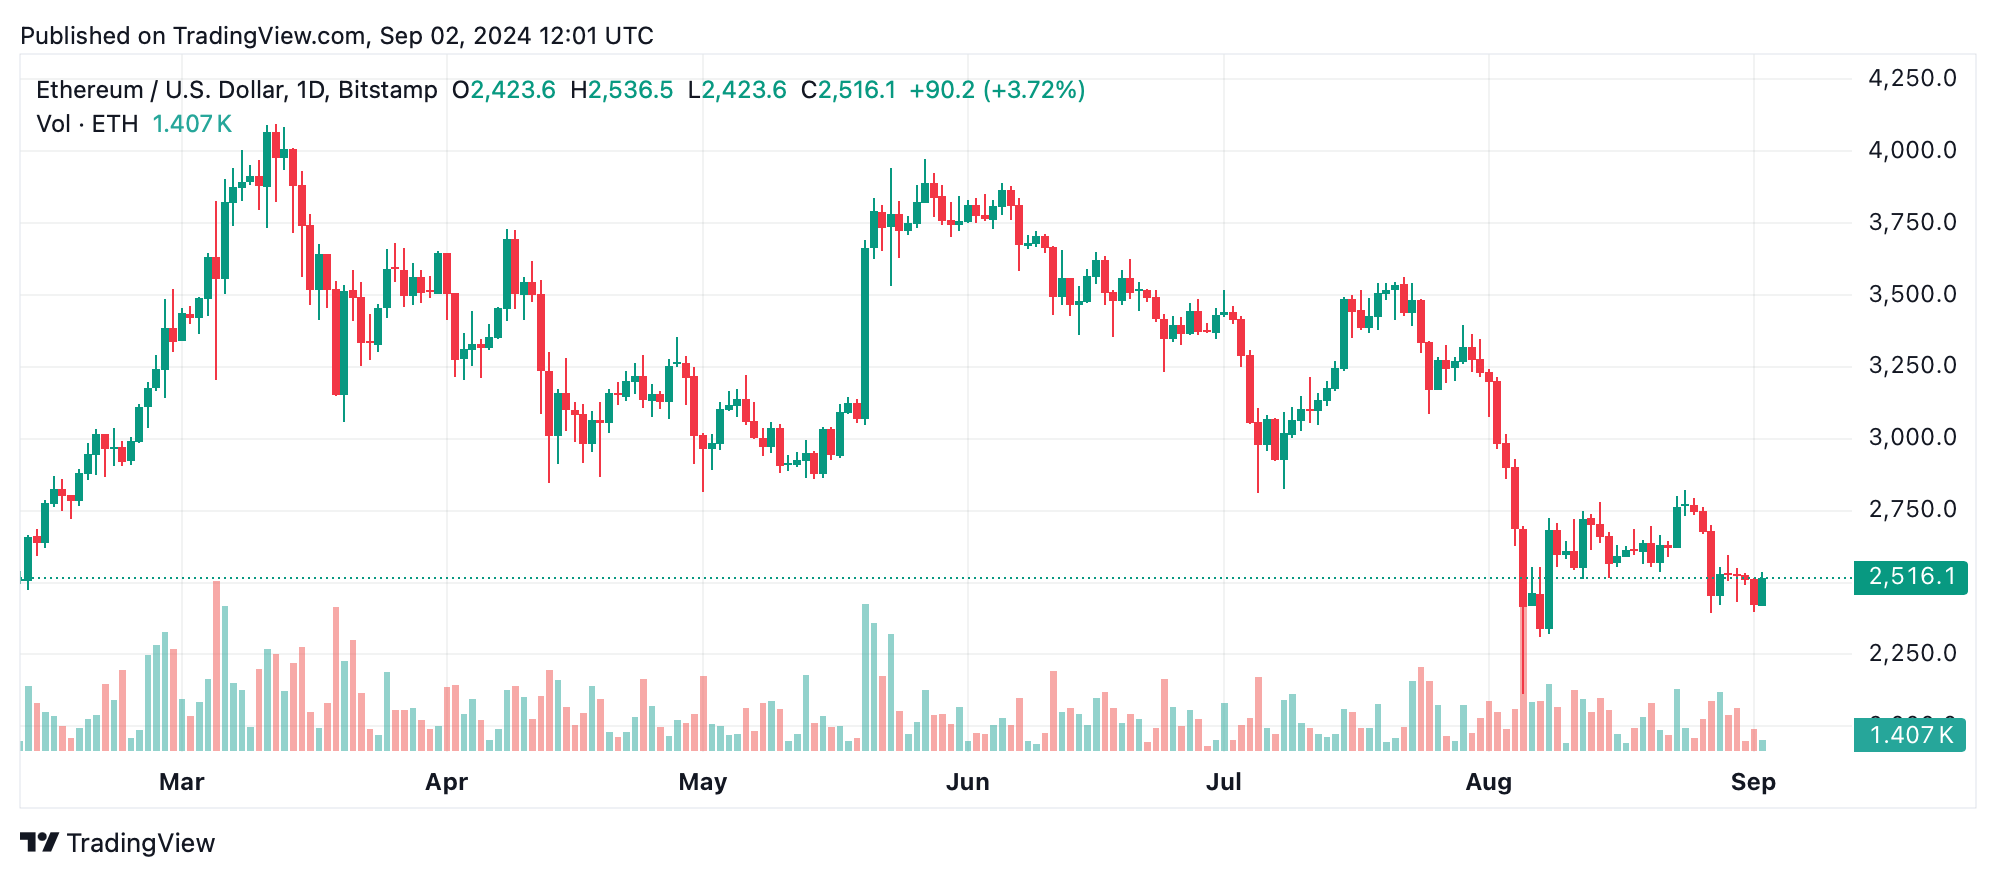
ETH/USD daily chart.
The 4-hour chart offers a more detailed view of ethereum’s price movements, showing a sharp sell-off followed by consolidation. Key support is found around $2,390 to $2,420, with resistance near $2,595, where recent bullish attempts faced rejection. The increase in volume accompanying the latest positive upswing may suggest the beginning of a potential recovery, but this is not yet confirmed by broader market sentiment.
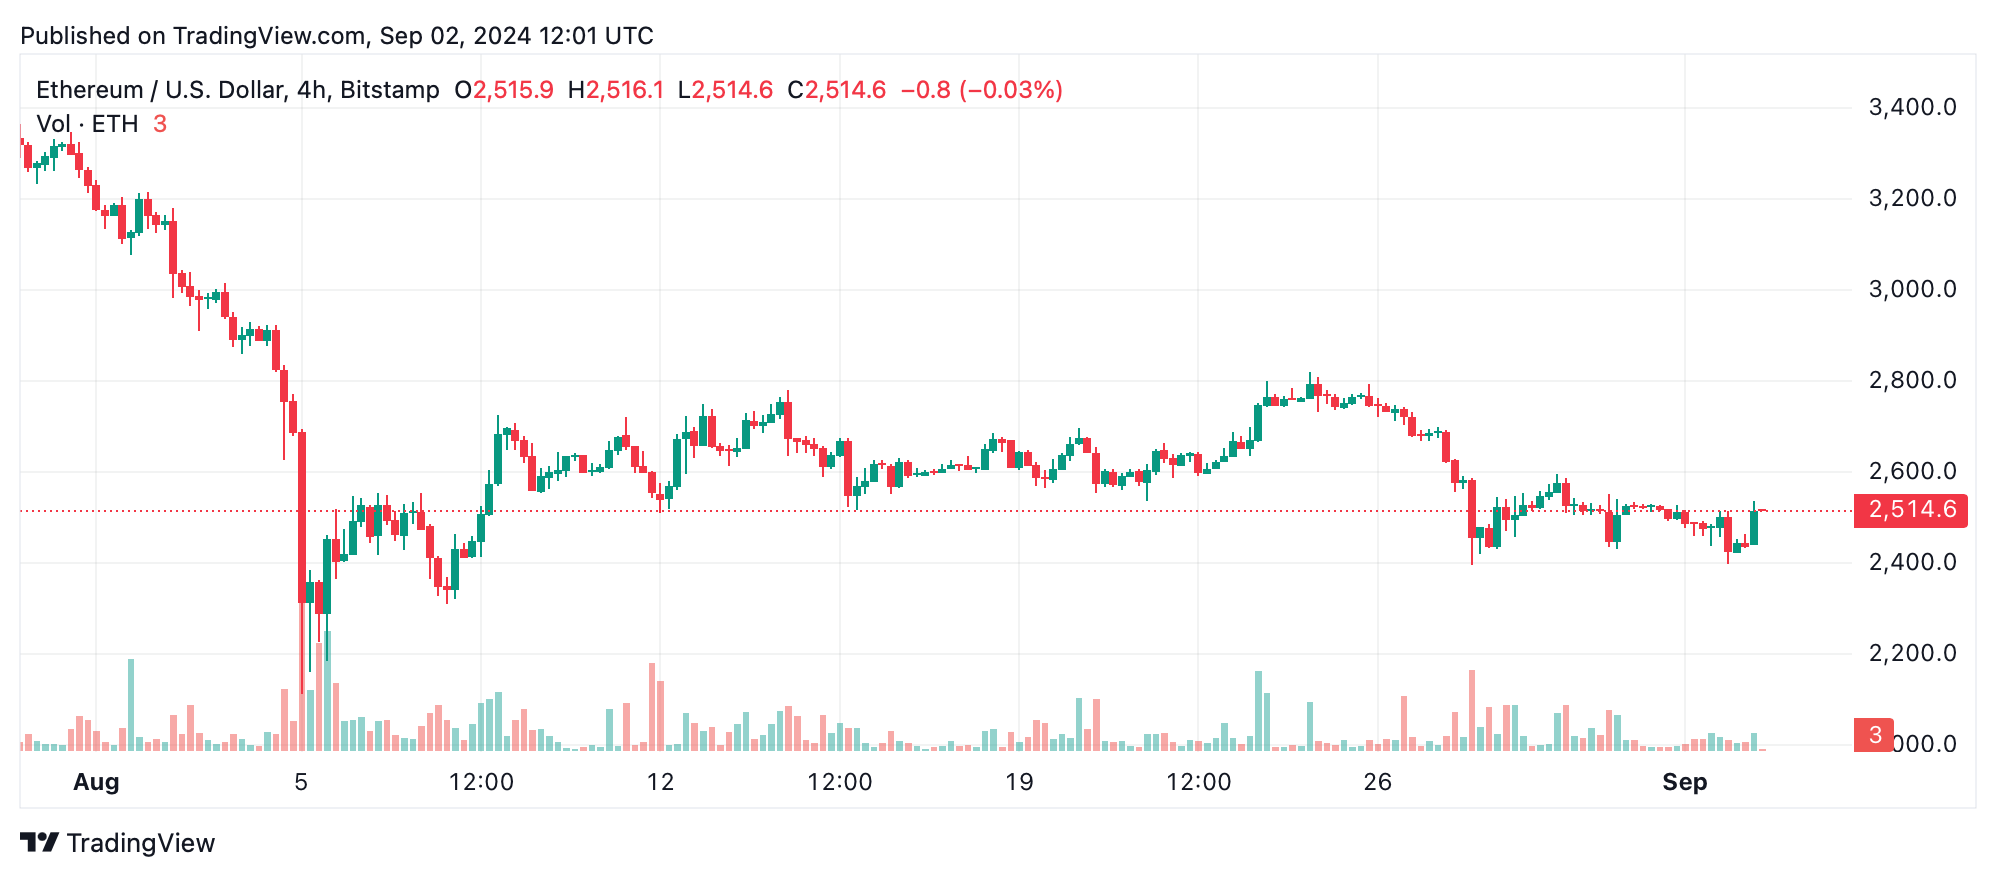
ETH/USD 4-hour chart.
On the 1-hour chart, ethereum experienced a strong recovery from the $2,397 level up to $2,538, followed by a slight pullback, indicating cautious optimism. The resistance around $2,538 to $2,550 is crucial as the price currently stalls at this level, with any breakout potentially leading to further gains if supported by sufficient volume.
Oscillators and moving averages (MAs) mostly indicate bearish momentum, reinforcing the cautious outlook. The relative strength index (RSI) stands neutral at 42.1, while the commodity channel index (CCI) at -100.8 suggests a buy signal. However, the momentum oscillator and moving averages, particularly the 10, 20, 50, and 200-period moving averages, signal a sell, reflecting the prevailing downtrend in ethereum’s price action.
Despite the prevailing bearish indicators, ethereum’s ability to hold its ground near key support levels and the recent uptick in buying volume hint at a possible short-term recovery. If ethereum can break above the $2,600 resistance level with strong volume, it may signal the beginning of a bullish reversal, potentially paving the way for a test of higher resistance levels near $2,800.
Ether’s overall technical outlook remains bearish, with most oscillators and MAs signaling continued downward pressure. The lack of strong buying interest and the persistent downtrend suggest that ethereum could be vulnerable to further declines. If the price fails to break above the $2,600 resistance and loses support near $2,400, a deeper ether sell-off could ensue, potentially driving prices lower in the near term.