
With a price of $2.155 to $2.163 over the last hour, a market cap of $124 billion, and a global trade volume of $2.29 billion, XRP is moving within a narrow 24-hour intraday range of $2.07 to $2.13. As momentum builds, technical indicators across multiple timeframes reveal a poised but cautious market atmosphere, hinting at potential upside should volume confirm key resistance breaches.

XRP
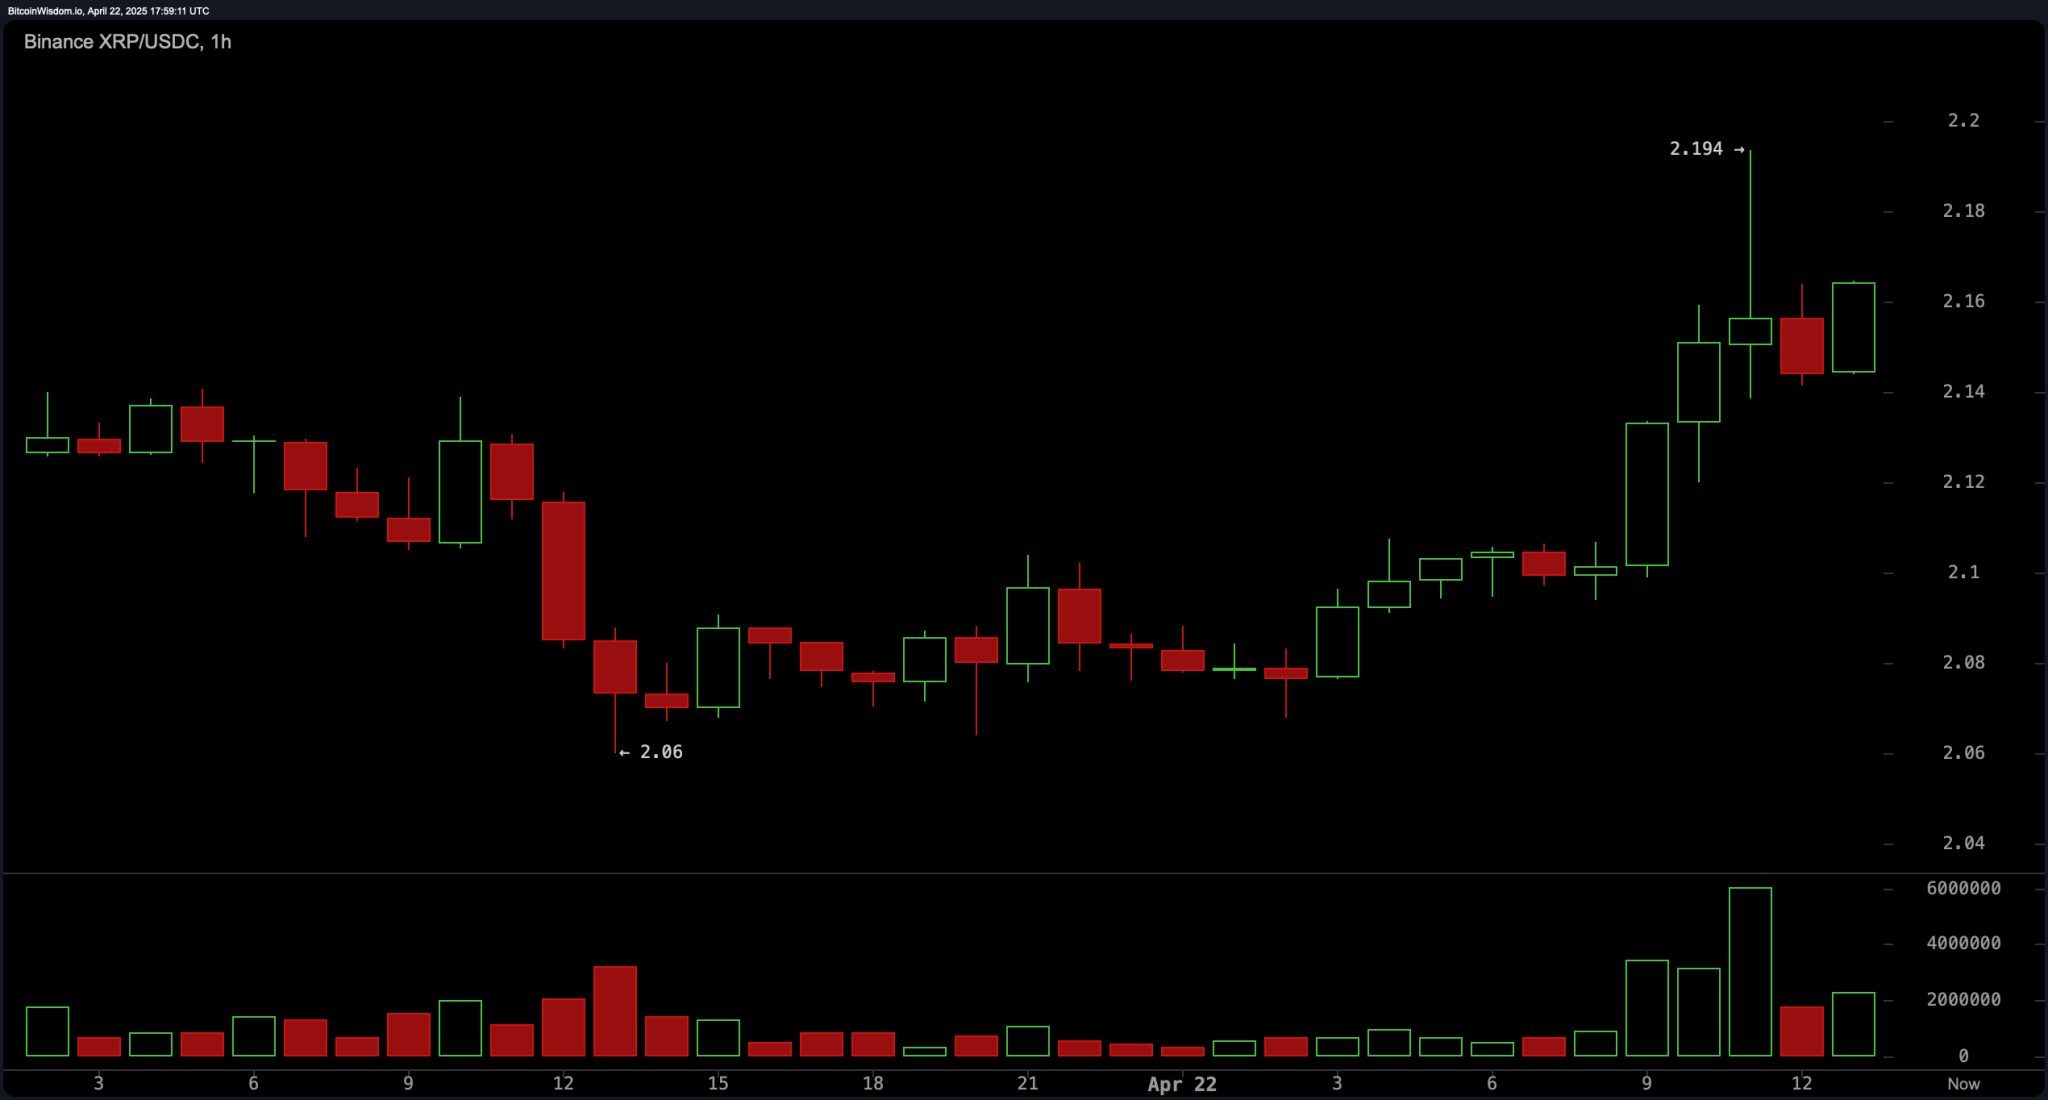
In the 1-hour chart, XRP has exhibited a micro breakout from $2.06 to $2.194, supported by a marked increase in volume. This short-term move reflects strong buying interest and accumulation, especially evident in the highest hourly volume bar. Immediate momentum favors the bulls, and the price could retest the breakout zone between $2.11 and $2.12 before pushing higher. Traders may consider entries around the $2.10 to $2.12 range, particularly if volume sustains or builds. Upside scalp targets sit around $2.18, with a potential swing target at $2.25, while a tight stop-loss under $2.08 offers risk management.
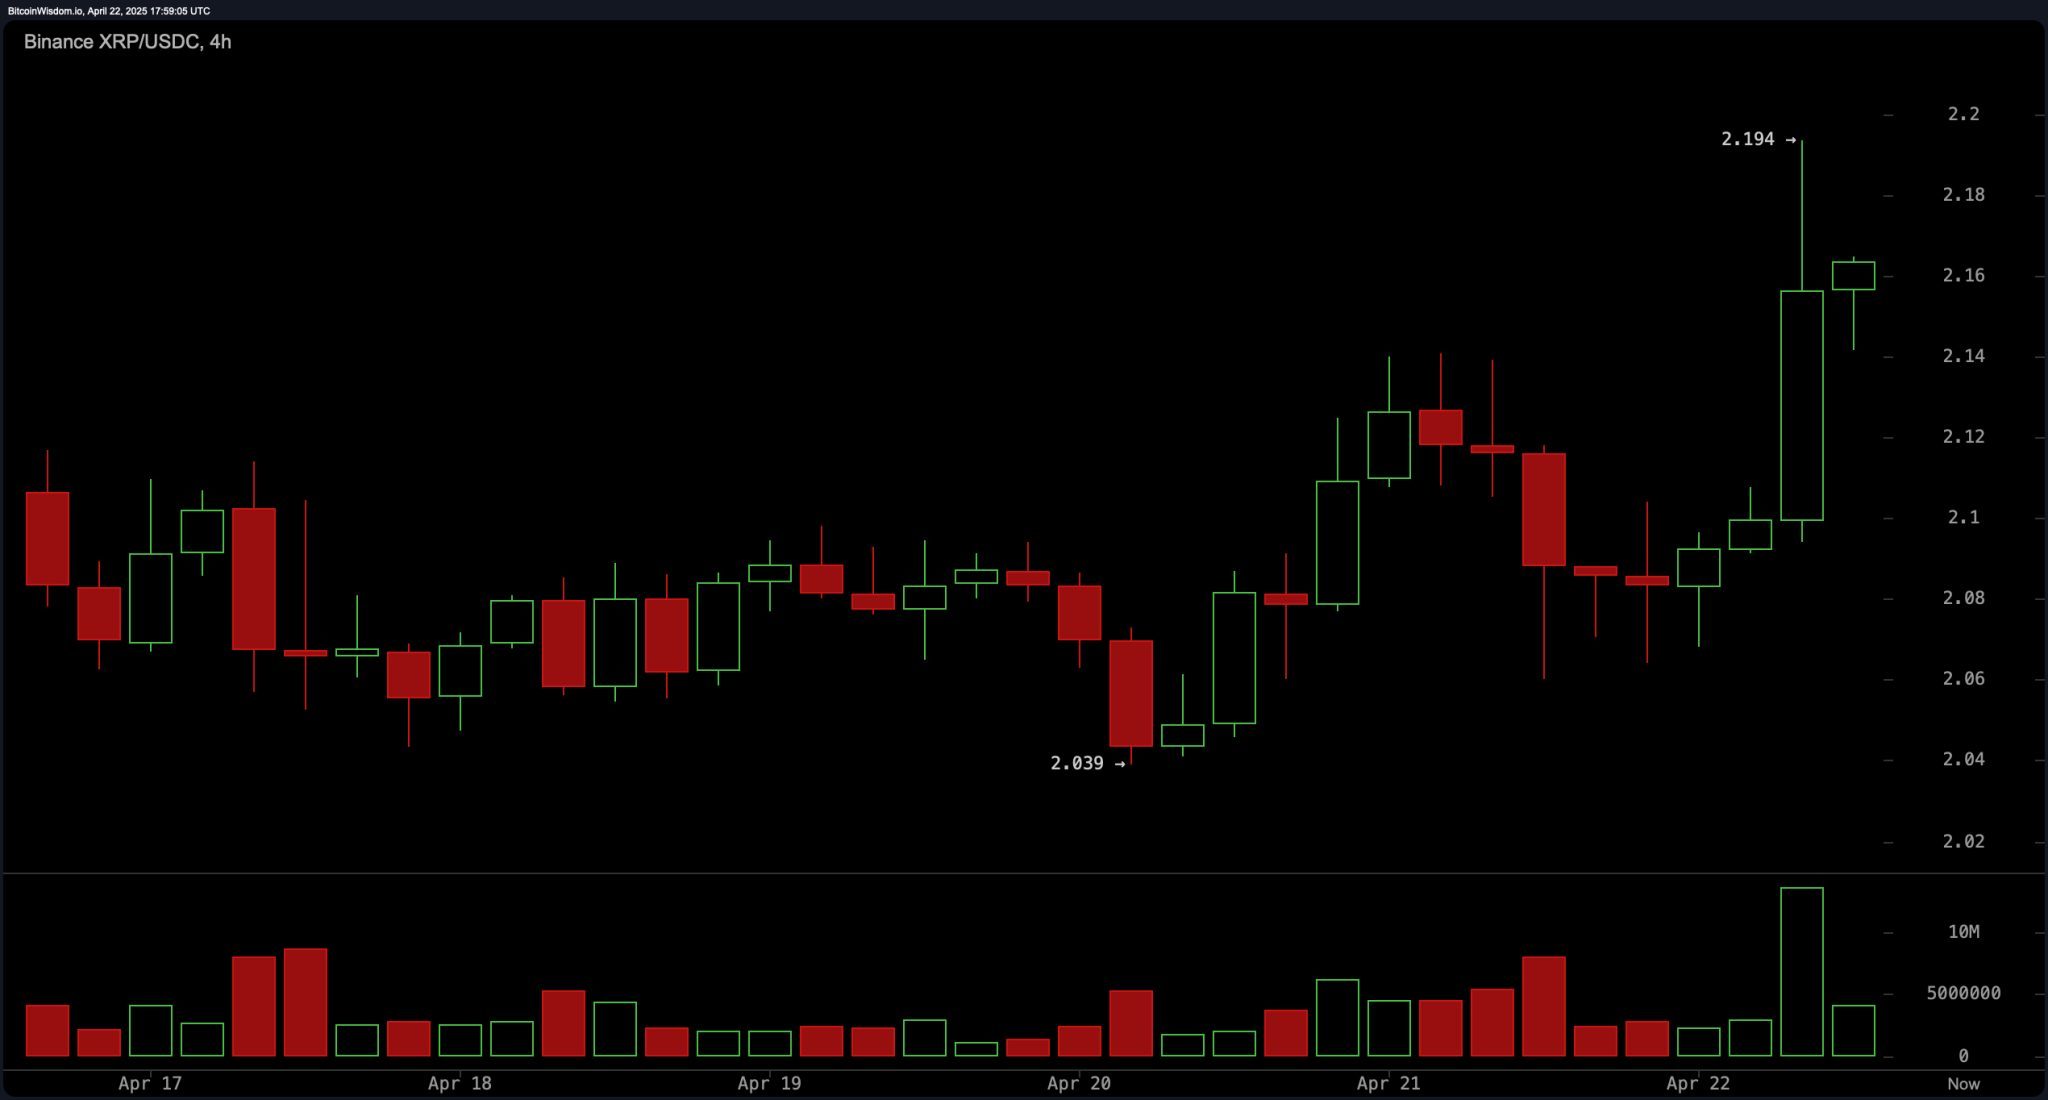
The 4-hour chart reflects a developing short-term bullish structure, with higher lows supporting a range from $2.039 (support) to $2.141 (resistance). A recent strong green candle within the $2.12 to $2.14 window highlights increasing buying pressure and optimism for a breakout. A confirmed close above $2.14 would signal further bullish momentum, while more aggressive entries may seek to exploit dips toward $2.08. Price targets lie in the $2.18 to $2.20 corridor, with protective stops recommended below the $2.03 support zone.
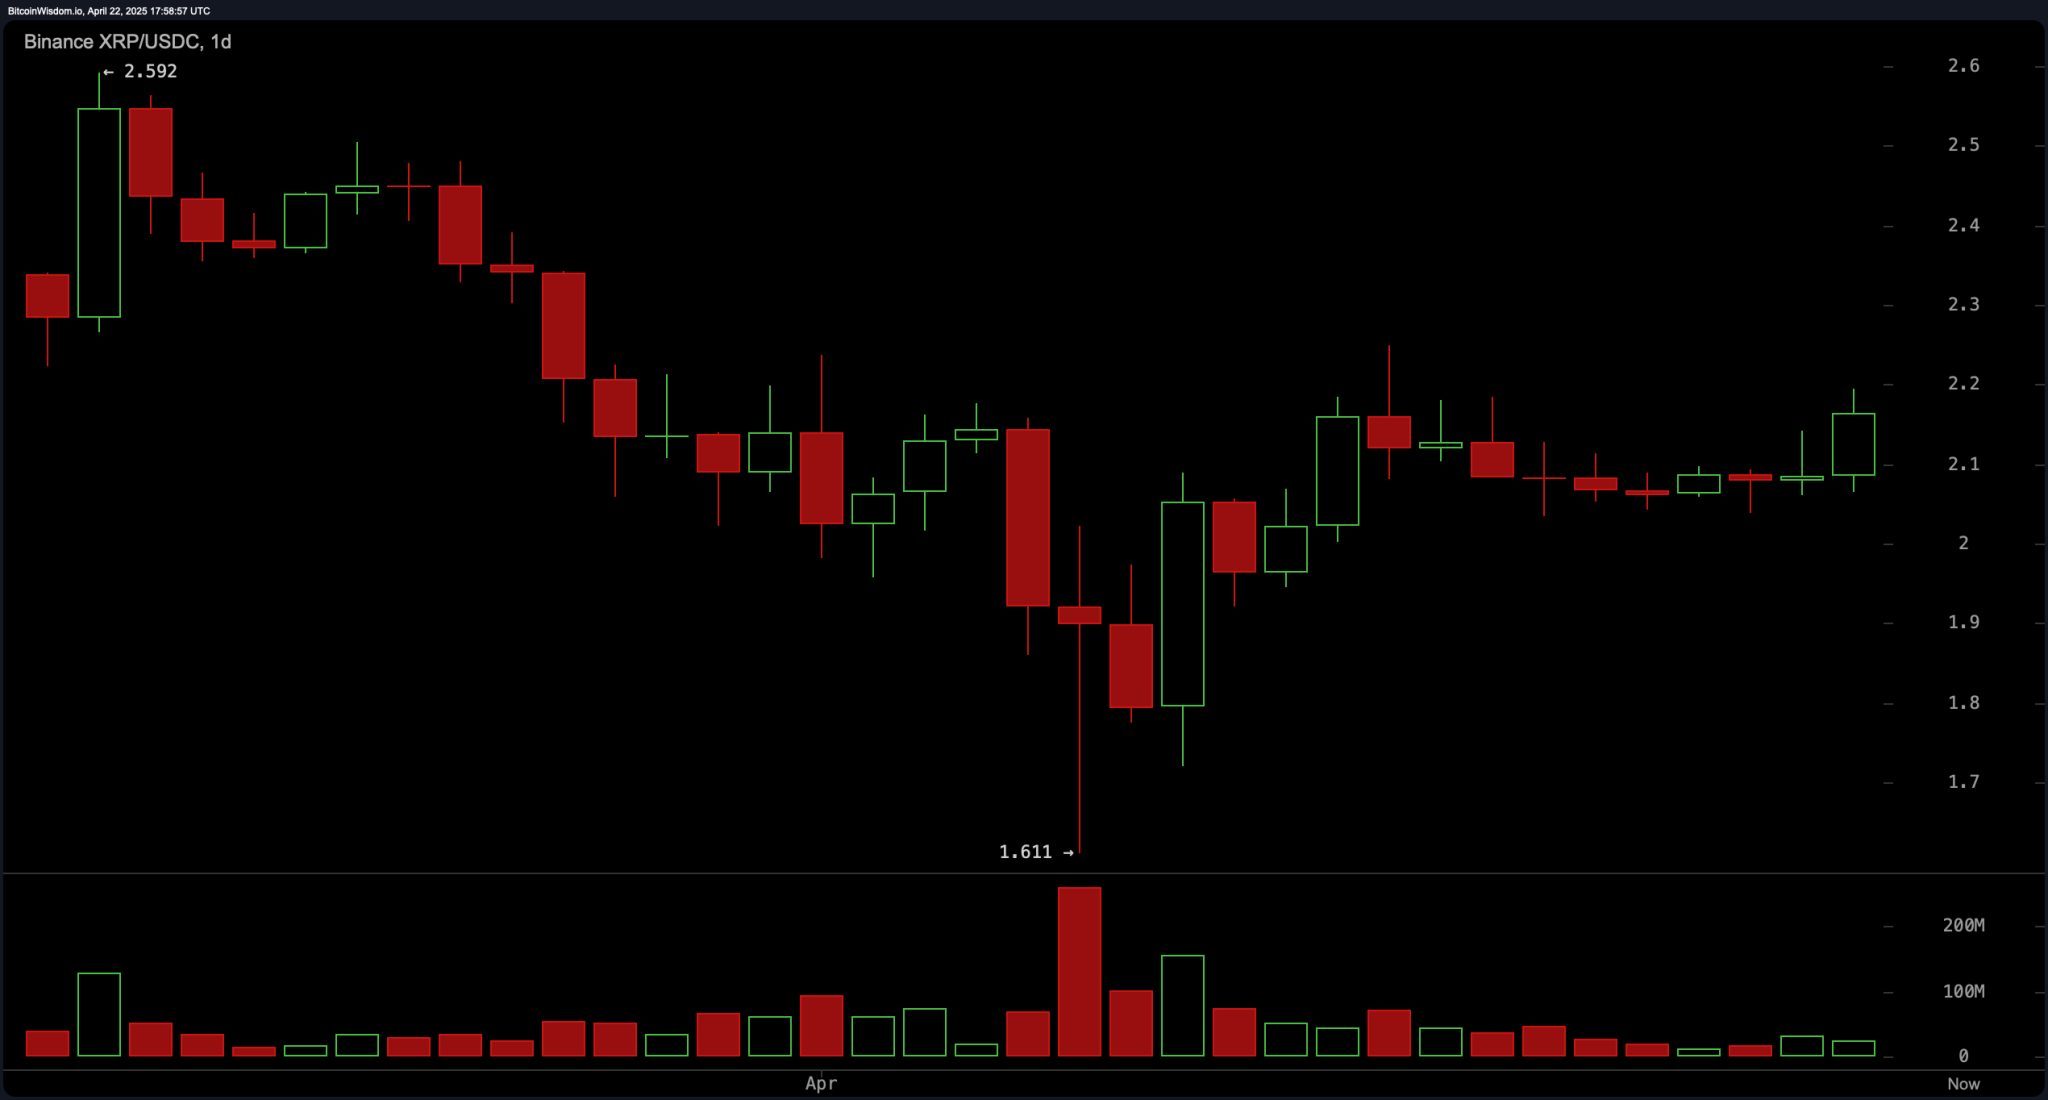
From the daily perspective, XRP has rebounded from a strong support base at $1.611—an area of significant buying volume—rebounding into a consolidation pattern above $2.00. Price action between $2.05 and $2.10 now marks a critical entry zone, where volume confirmation may herald a bullish breakout. Near-term resistance levels include $2.40 and $2.60, aligning with prior swing highs and psychological markers. This suggests the market is stabilizing, and bullish continuation is plausible if accumulation persists. A stop-loss under $1.90, or more conservatively under $1.611, provides risk-controlled exposure to further gains.
Oscillators paint a largely neutral sentiment, underscoring the market’s indecision and potential readiness for a breakout. The relative strength index (RSI) at 51.09405, Stochastic at 73.85584, commodity channel index (CCI) at 59.92234, average directional index (ADX) at 19.81293, and the awesome oscillator at -0.06885 all indicate a holding pattern. Notably, the momentum oscillator at -0.02656 flashes a bearish signal, while the moving average convergence divergence (MACD) level at -0.02901 tips slightly bullish with a buy signal—showcasing the tug-of-war between consolidation and breakout optimism.
Turning to the moving averages, shorter-term indicators are leaning bullish. The exponential moving average (EMA) and simple moving average (SMA) across the 10, 20, and 30-period timeframes all signal bullishness, with prices ranging from $2.05 to $2.12. However, longer-term moving averages tell a mixed story: while the EMA and SMA for the 50 and 100-periods reflect bearish conditions with values above the current price, the 200-period EMA and SMA remain bullish, suggesting broader structural strength. This juxtaposition of short-term bullishness and long-term resilience may be laying the groundwork for a sustained breakout should conditions align.
Bull Verdict:
XRP’s consolidation above the $2.00 threshold, coupled with bullish momentum in the 1-hour and 4-hour charts and strong support near $1.61, sets the stage for an upward breakout. The alignment of short-term moving averages and a cautiously optimistic MACD (moving average convergence divergence) signal enhances the case for continued bullish action, particularly if volume supports a decisive move above $2.18.
Bear Verdict:
Despite localized strength, XRP’s momentum oscillator and longer-term moving averages suggest potential vulnerability beneath the surface. With oscillators largely neutral and multiple higher timeframe moving averages flashing sell signals, failure to break above $2.18 with conviction—or a drop below $2.03—could trigger a pullback toward the $1.90 level or even retest the $1.61 support.