
XRP has fluctuated between $2.48 and $2.52 in the past hour, supported by a $144 billion market capitalization. Within the same period, it recorded a 24-hour trade volume of $7.57 billion and an intraday price range spanning $2.38 to $2.59.
XRP
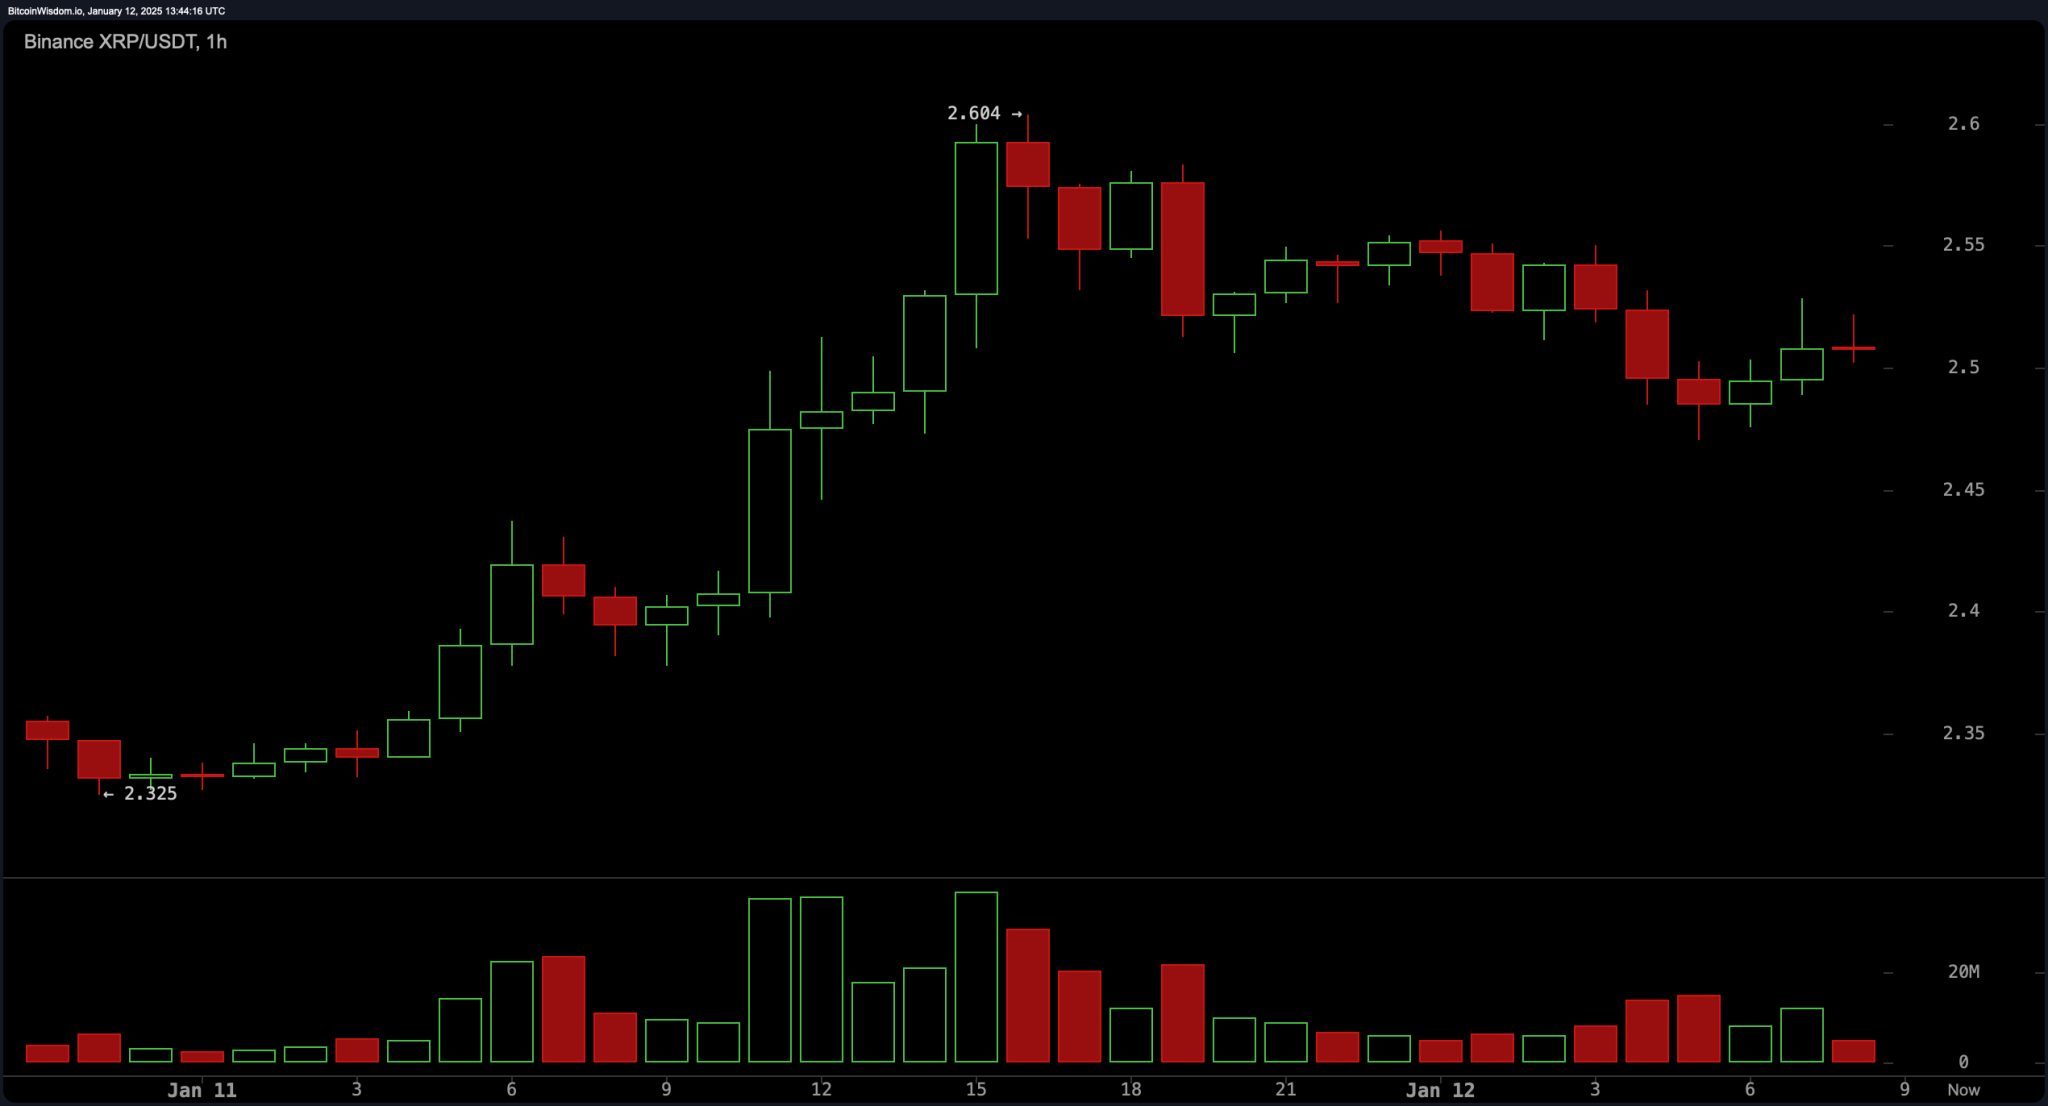
On the hourly chart, XRP appears to be in a phase of micro-consolidation, finding equilibrium near $2.50 after reaching a local peak of $2.604. Resistance emerges between $2.55 and $2.60, with support anchored at $2.45. This phase of declining volume suggests a measured correction rather than a bearish shift, presenting traders with potential short-term entry points near support levels, targeting exits between $2.60 and $2.65.
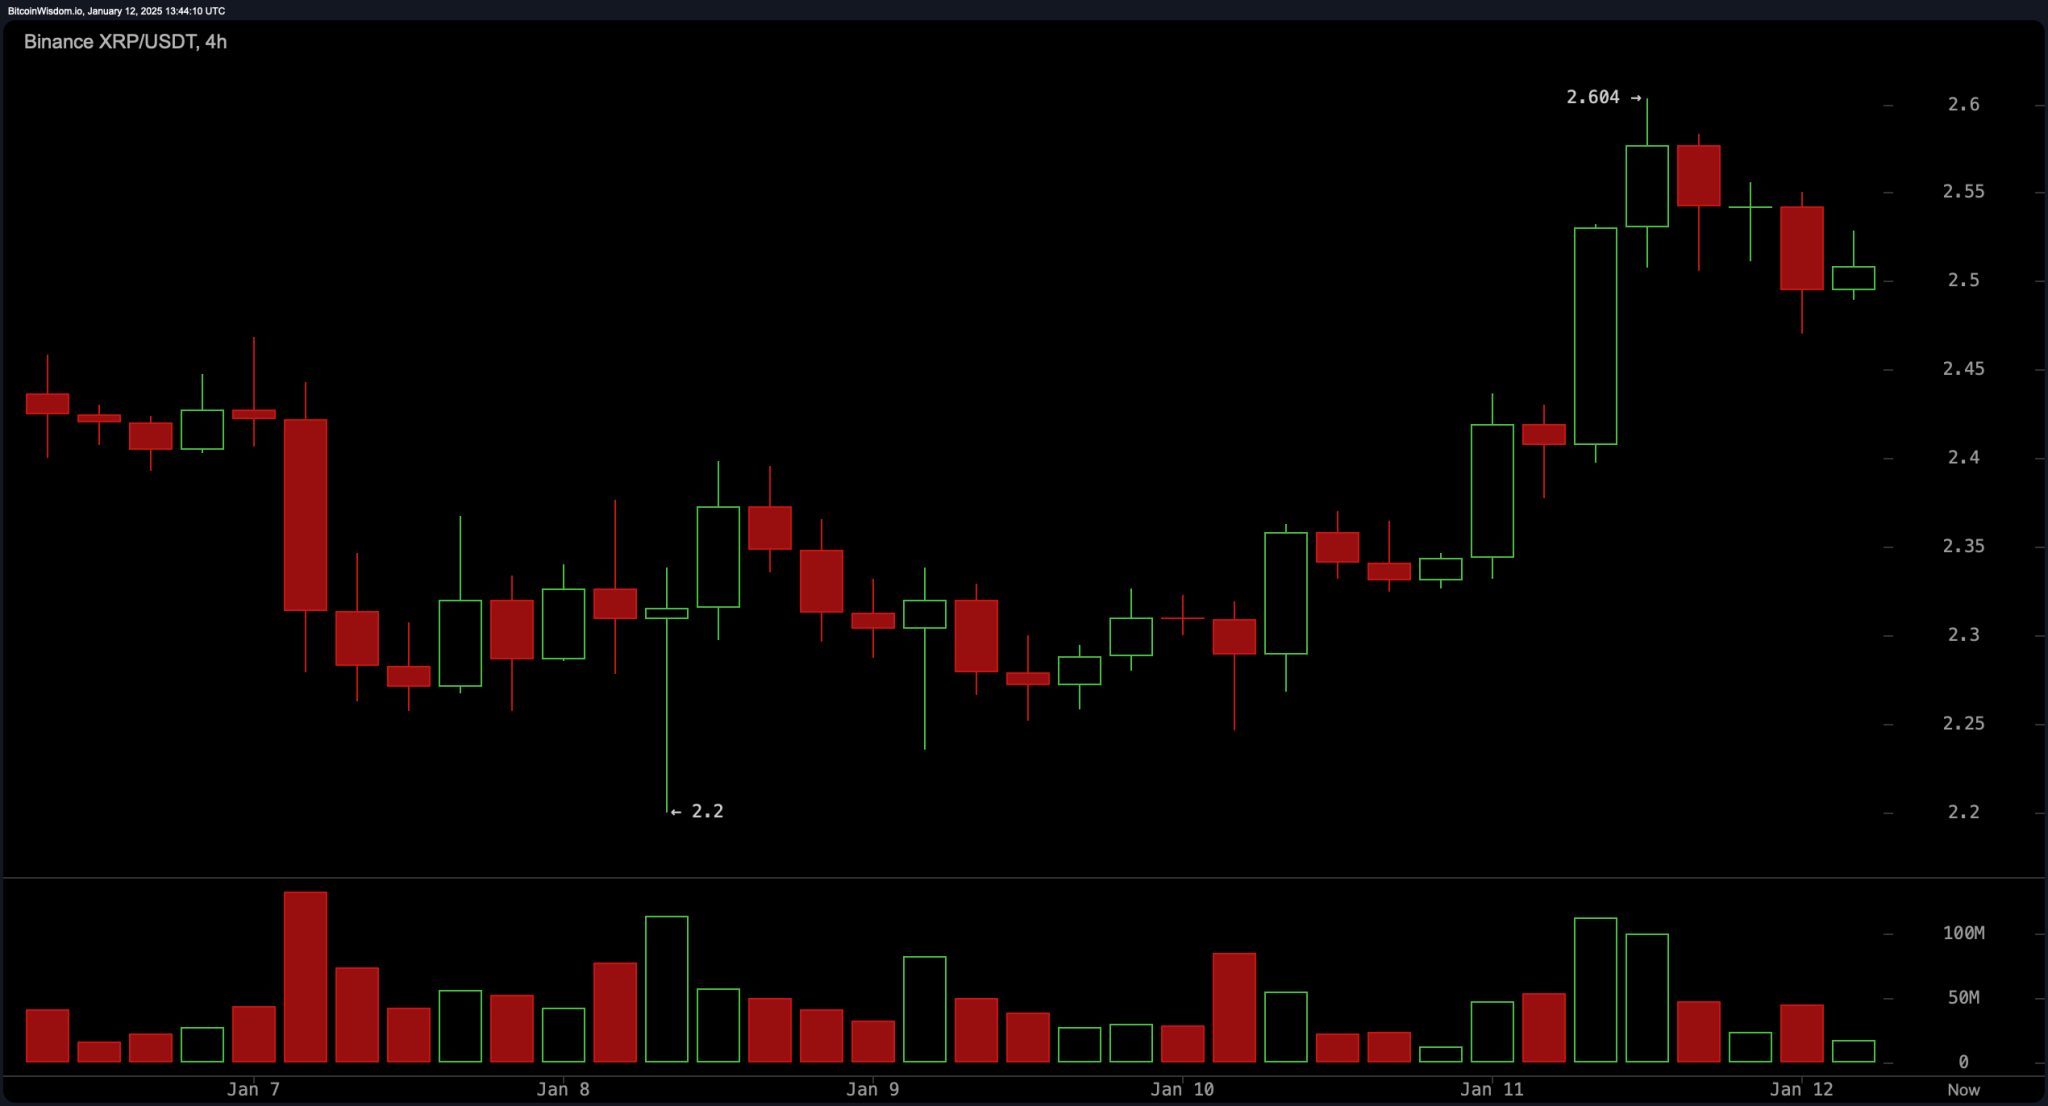
Zooming out to the 4-hour chart, XRP retains its upward trajectory following a substantial price rally earlier in the week, stabilizing near $2.50. Resistance zones lie at $2.60 and $2.70, with support reliably holding between $2.45 and $2.50. Strategically, traders might consider entry opportunities on a confirmed breakout above $2.60 or a retracement to $2.45, setting profit targets within the $2.60 to $2.70 range.
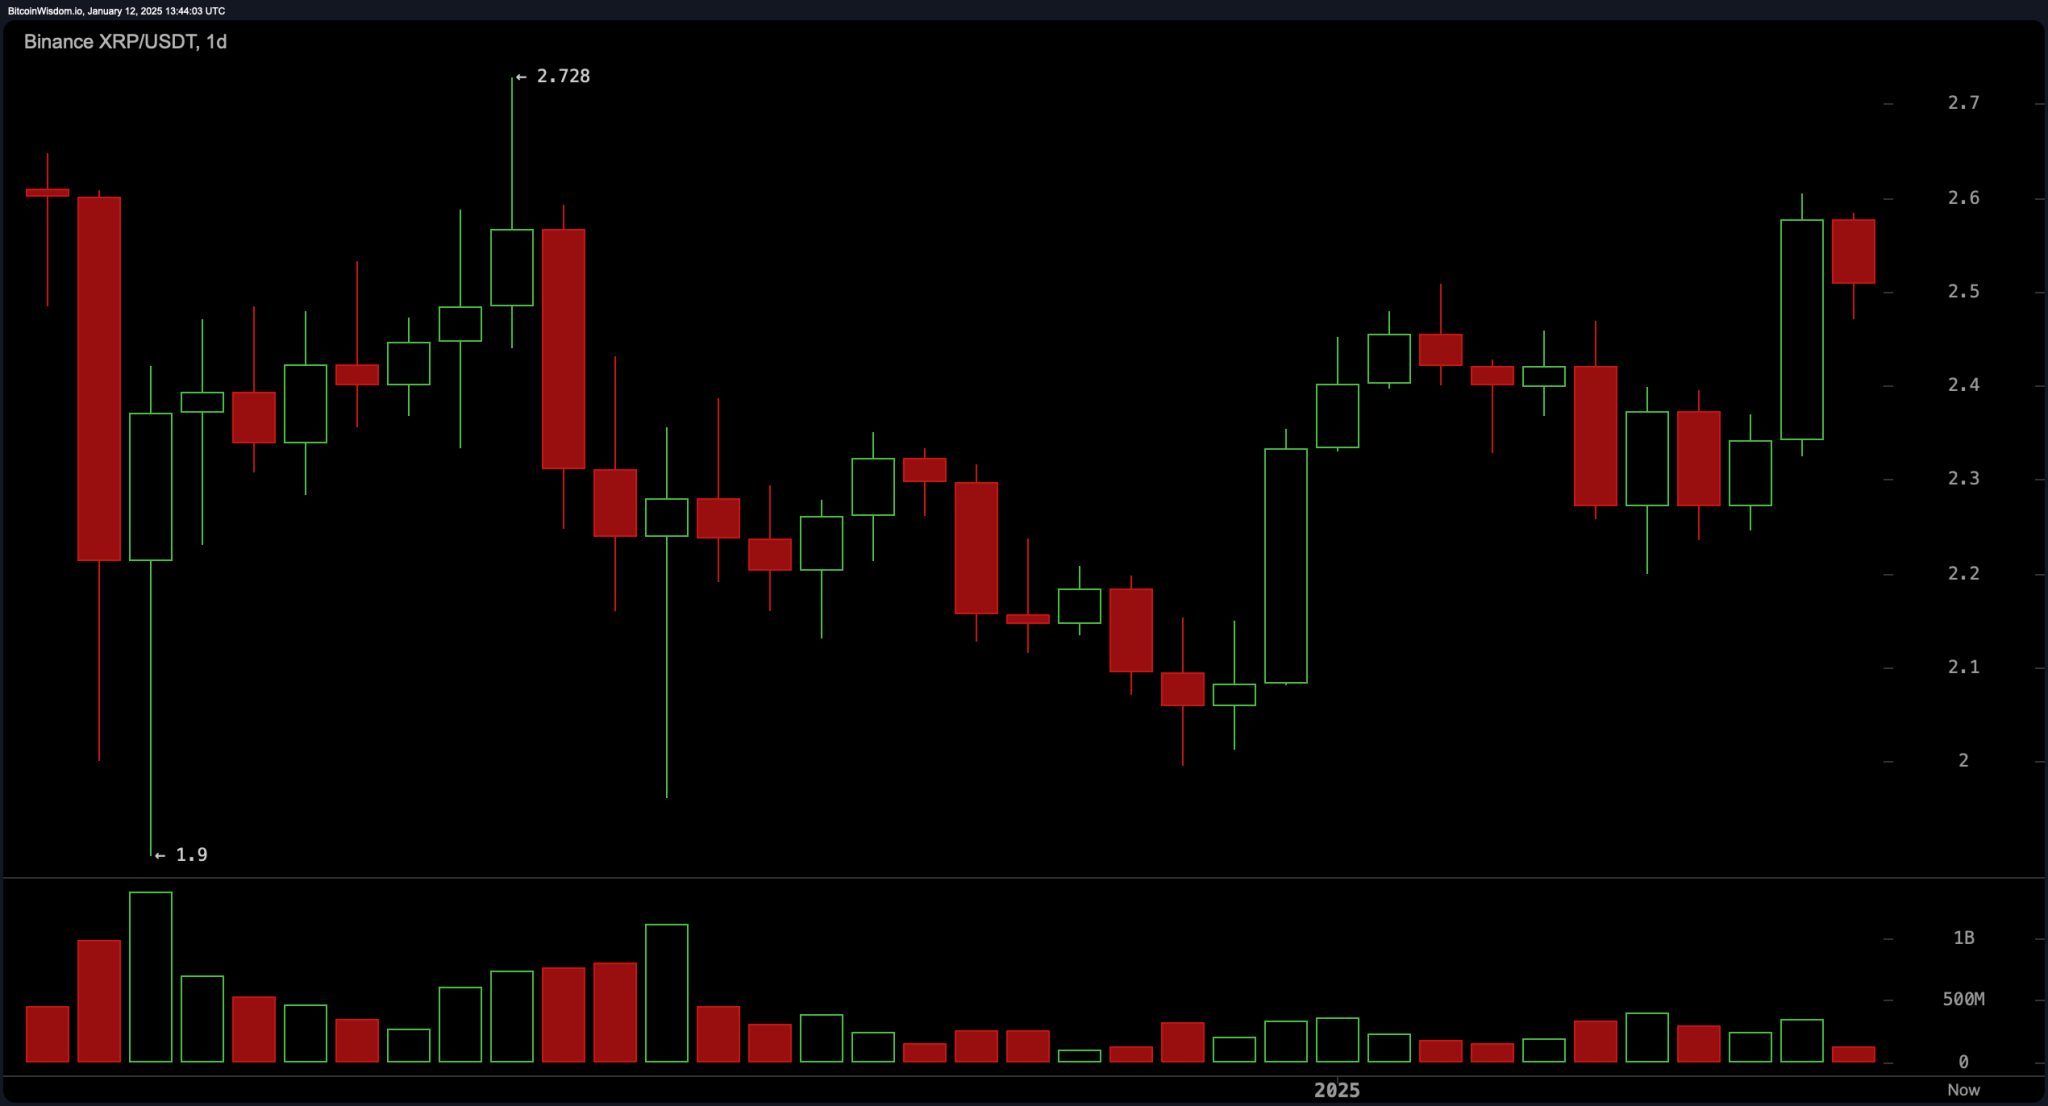
On the daily timeframe, XRP exhibits a broader recovery pattern, climbing from a recent low near $2.20 to an intraday high of $2.72 before slightly retracing. Notably, increased buying volume on bullish candles reflects renewed market interest. Resistance at $2.72 and support at $2.40 define key levels to watch for further price movement.
Technical oscillators reveal a nuanced outlook. The relative strength index (RSI) reads 58.99, signaling neutrality, while the Stochastic oscillator, at 82.71, leans toward overbought conditions. Meanwhile, the moving average convergence divergence (MACD) indicates a positive signal at 0.07805, counterbalanced by selling pressure suggested by the momentum oscillator at 0.10760 and the commodity channel index (CCI) at 137.10.
Across all timeframes, moving averages remain bullish. Both exponential and simple moving averages across 10, 20, 50, 100, and 200 periods align to reflect favorable buy conditions. This alignment signals that market sentiment for XRP remains optimistic, contingent on the asset surpassing critical resistance thresholds.
Bull Verdict:
XRP’s current technical setup paints a picture of optimism, with bullish signals from moving averages across all timeframes and buying interest reflected in recent volume patterns. A successful breakout above $2.6, accompanied by strong volume, could pave the way for further gains toward $2.7 and beyond. The broader recovery trend suggests that XRP is well-positioned for potential upside if resistance levels are decisively breached.
Bear Verdict:
Despite the upward momentum, XRP faces significant hurdles at resistance zones between $2.6 and $2.7, while oscillators signal caution with overbought conditions and selling pressure creeping in. A failure to hold support at $2.45 could lead to further downside, testing levels below $2.4. Traders should remain vigilant for signs of a deeper correction if buying momentum falters.