
XRP is trading at $2.60, with a market capitalization of $150 billion and a 24-hour trading volume of $5.67 billion, moving within an intraday range of $2.48 to $2.63 as traders assess key technical levels across multiple timeframes.

XRP
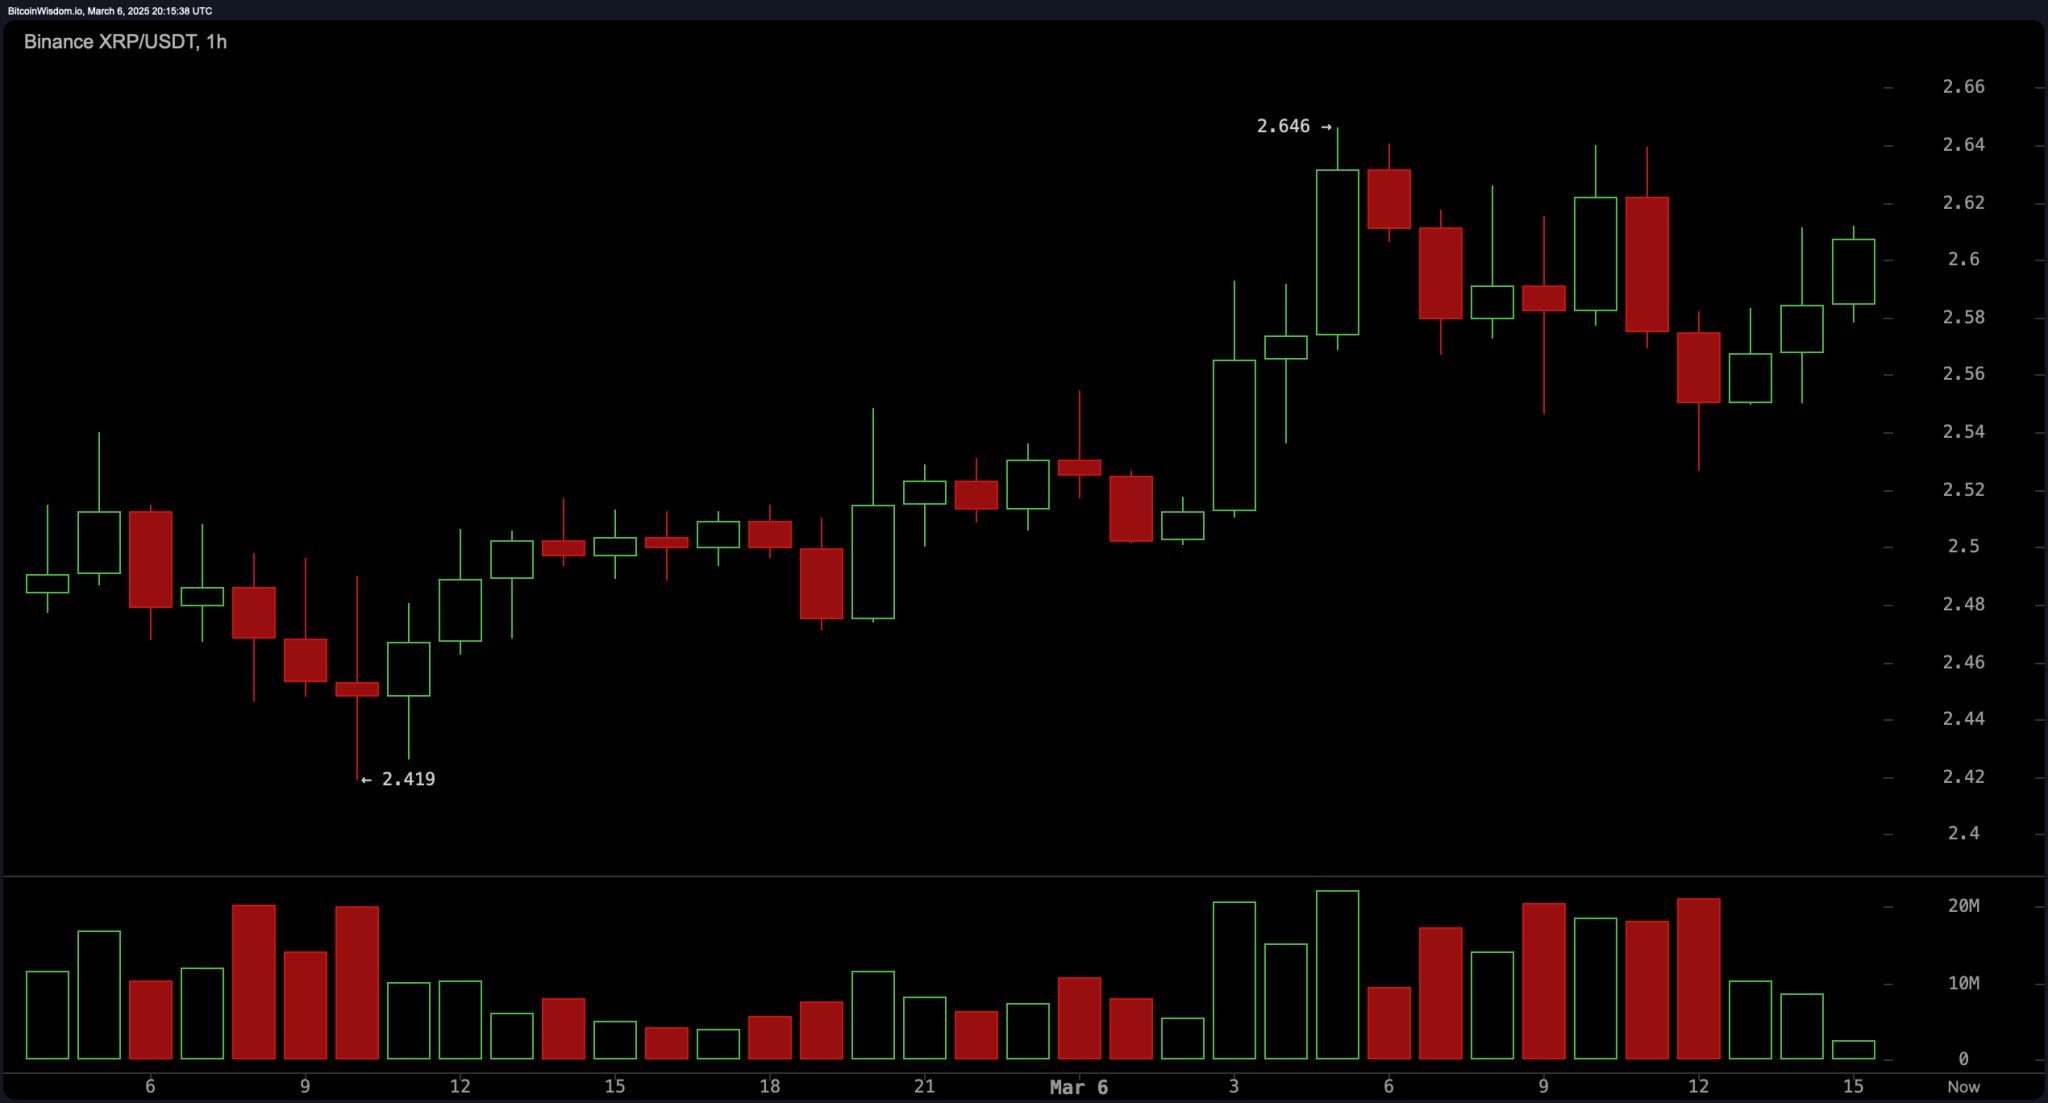
XRP’s 1-hour chart indicates a short-term consolidation with higher lows forming, suggesting potential accumulation. Immediate support is observed between $2.55 and $2.60, while resistance stands at $2.65 to $2.70 per XRP. Volume is mixed, with intermittent spikes hinting at active participation from traders. A move below $2.50 could trigger additional selling pressure, whereas a breakout above $2.70 may push XRP toward the $3.00 resistance zone. The short-term outlook remains neutral to bullish, contingent on sustained buying momentum.
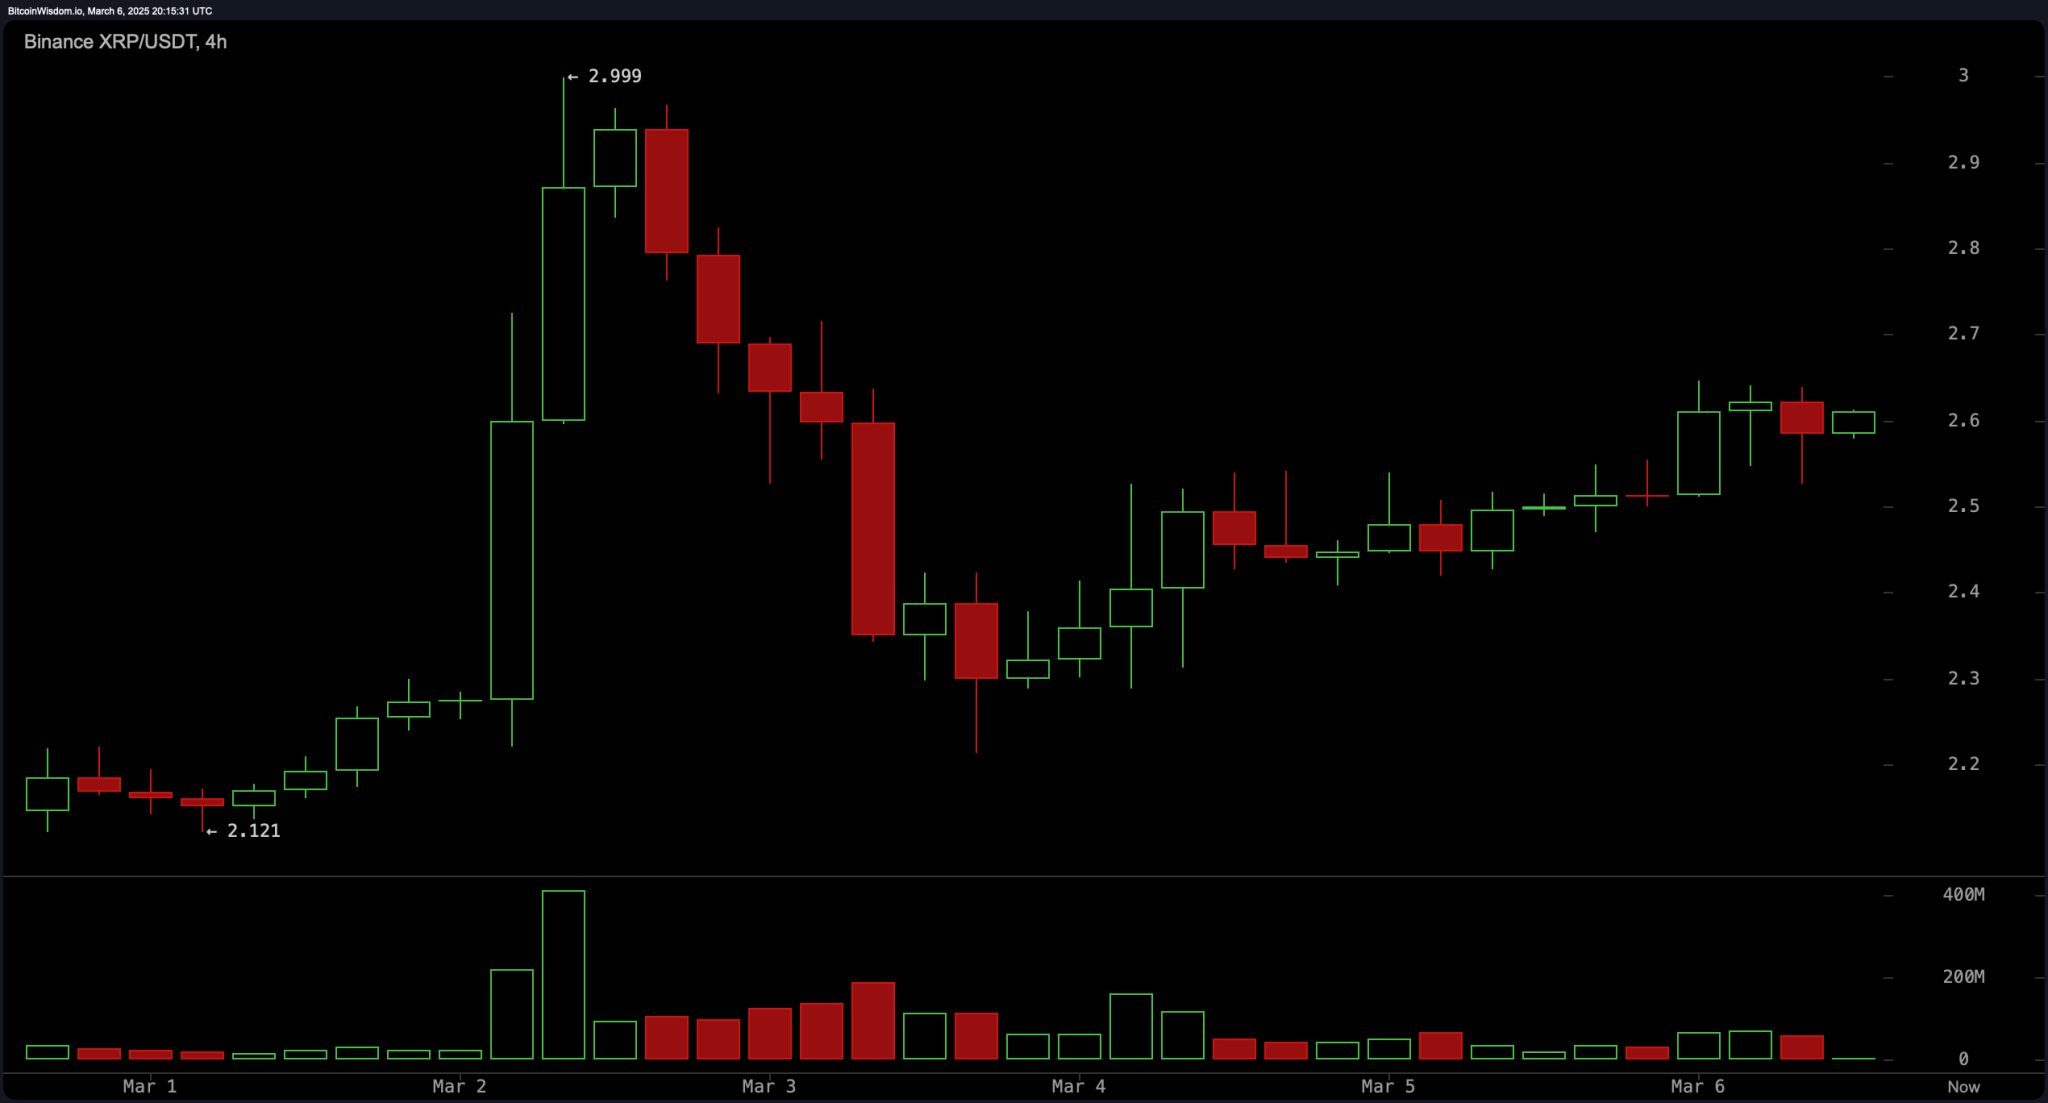
On the 4-hour chart, XRP exhibits a strong rally followed by a retracement and consolidation near key levels. Resistance is identified between $2.90 and $3.00, while support remains firm in the $2.40 to $2.50 range. Volume has slightly decreased, indicating a potential slowdown in bullish momentum. If XRP surpasses $2.70 with strong volume, an upward push toward $3.00 per XRP is likely. However, a failure to hold above $2.40 may expose the asset to further downside risk.
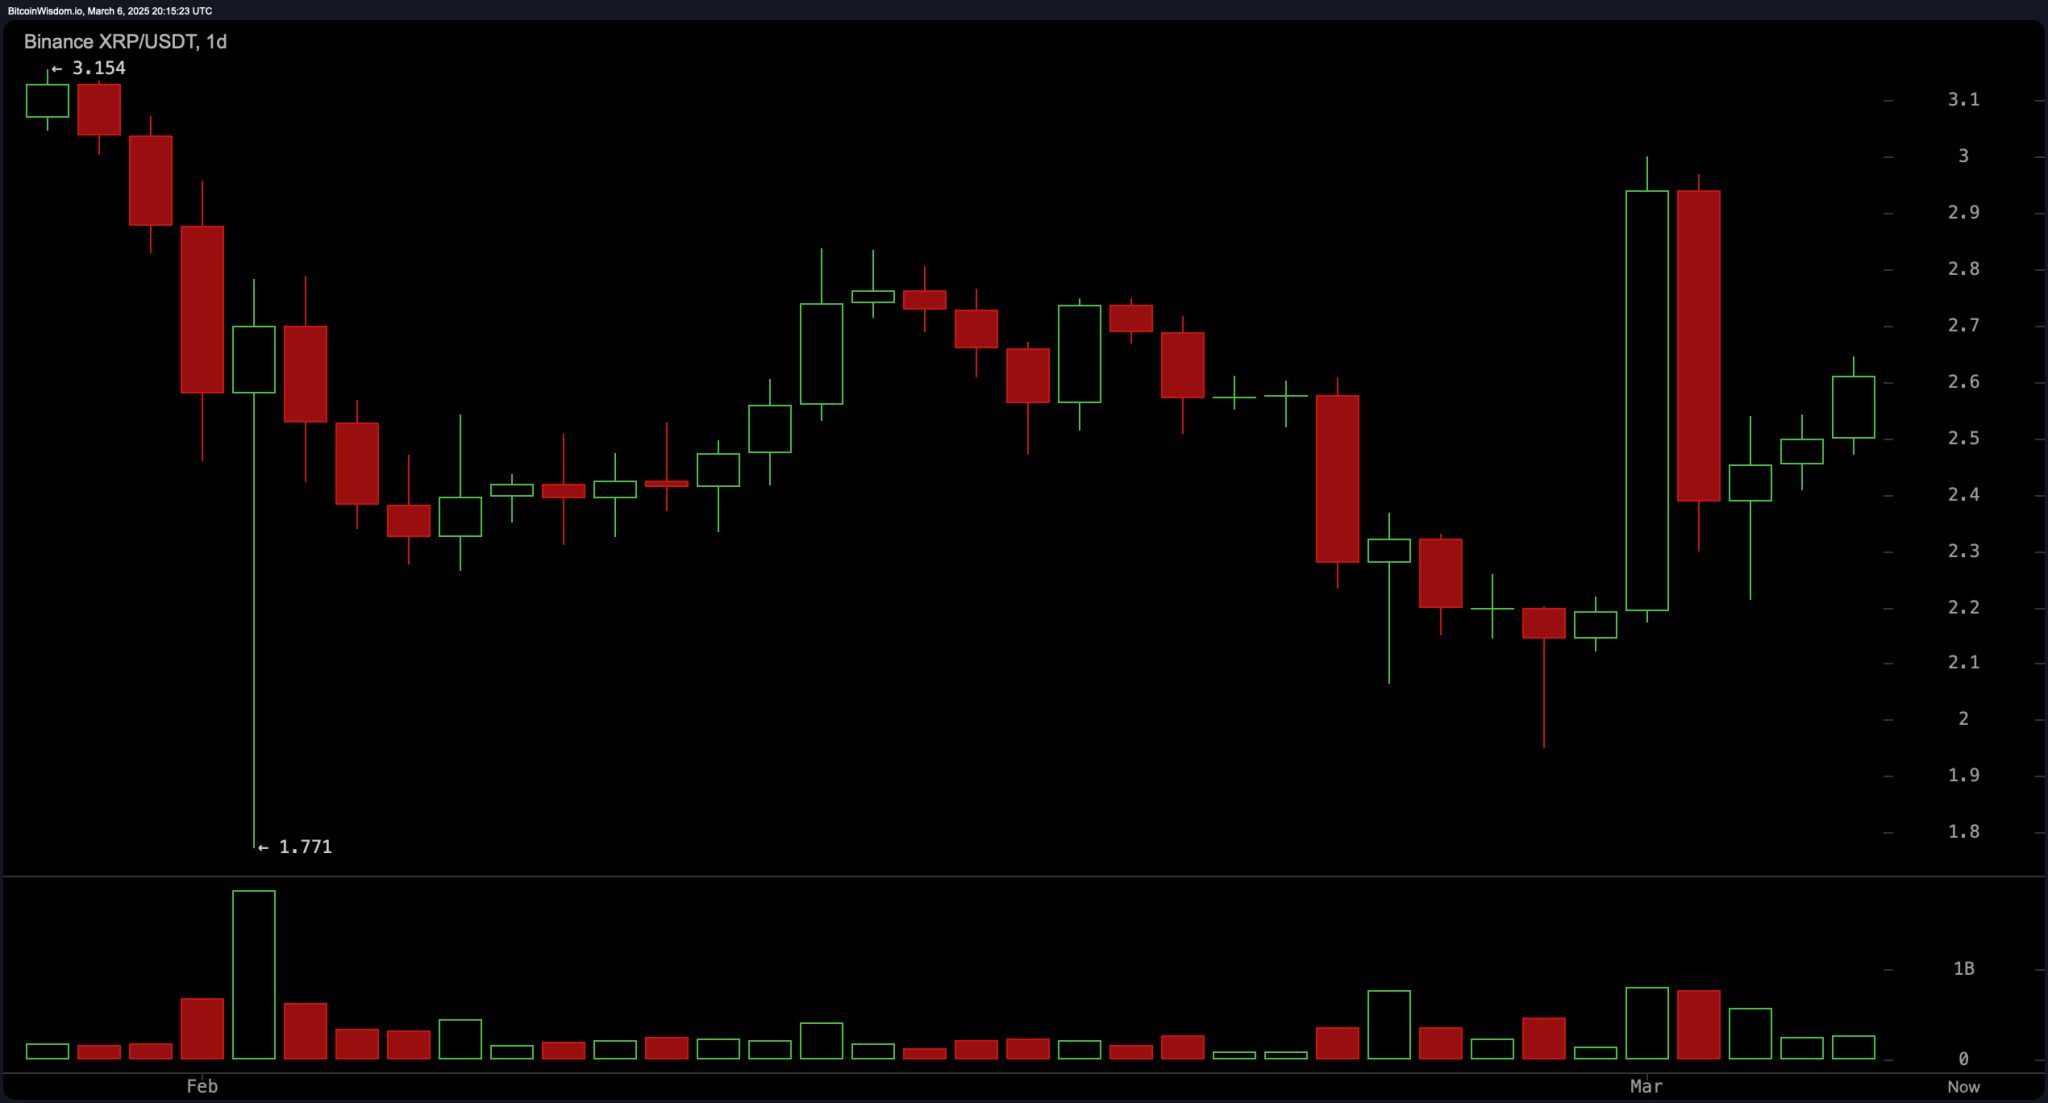
XRP’s daily chart reflects a broader recovery after a previous downtrend, with XRP rebounding from a low of $1.77. Major resistance is seen at $3.15, while support remains around $2.20 to $2.40. Increased trading volume on bullish candles signals robust buying interest, though price action suggests XRP may need further consolidation before making another decisive move. A pullback toward $2.40 to $2.50 could present a buying opportunity for swing traders targeting the $3.10 to $3.15 zone.
Oscillator readings show mixed signals, with the relative strength index (RSI) at 52.45, Stochastic at 52.83, the commodity channel index (CCI) at 29.70, and the average directional index (ADX) at 27.89, all maintaining neutral positions. Meanwhile, the awesome oscillator, momentum indicator, and moving average convergence divergence (MACD) level all signal a buying bias. These indicators suggest that while momentum is building, XRP lacks a clear overbought or oversold condition, reinforcing the ongoing consolidation phase.
Moving averages (MAs) provide a predominantly bullish outlook, with the exponential moving averages (EMA) and simple moving averages (SMA) for the 10, 20, 30, 50, 100, and 200-period timeframes mostly indicating a buy. Notably, the simple moving average (SMA) for the 50-period timeframe is the only sell signal, suggesting short-term resistance. The alignment of moving averages indicates a supportive trend, with long-term buyers likely viewing dips as opportunities to accumulate.
Bull Verdict:
XRP’s technical indicators and price action suggest a bullish bias, with strong support around $2.40 to $2.50 and the potential for an upward move toward the $3.00 to $3.15 resistance zone. The majority of moving averages indicate buying pressure, while oscillators remain neutral to slightly positive. If volume increases and XRP breaks above $2.70, the bullish momentum could accelerate, making higher levels achievable in the short to mid-term.
Bear Verdict:
Despite signs of accumulation, XRP faces key resistance at $2.70 and $3.00, with decreasing volume on the 4-hour chart suggesting weakening bullish momentum. The simple moving average (SMA) for the 50-period timeframe presents a sell signal, indicating potential short-term pressure. A failure to hold above $2.50 could expose XRP to a drop toward the $2.40 support range, and a break below that level may lead to further downside, challenging the bullish outlook.