
XRP is currently priced at $2.003 to $2.011 over the last hour, supported by a market capitalization of $117 billion and a 24-hour trading volume of $3.60 billion. Trading activity has remained concentrated within an intraday range of $1.93 to $2.03, as technical indicators across multiple timeframes show signs of possible reversal or continuation setups in the near term.

XRP
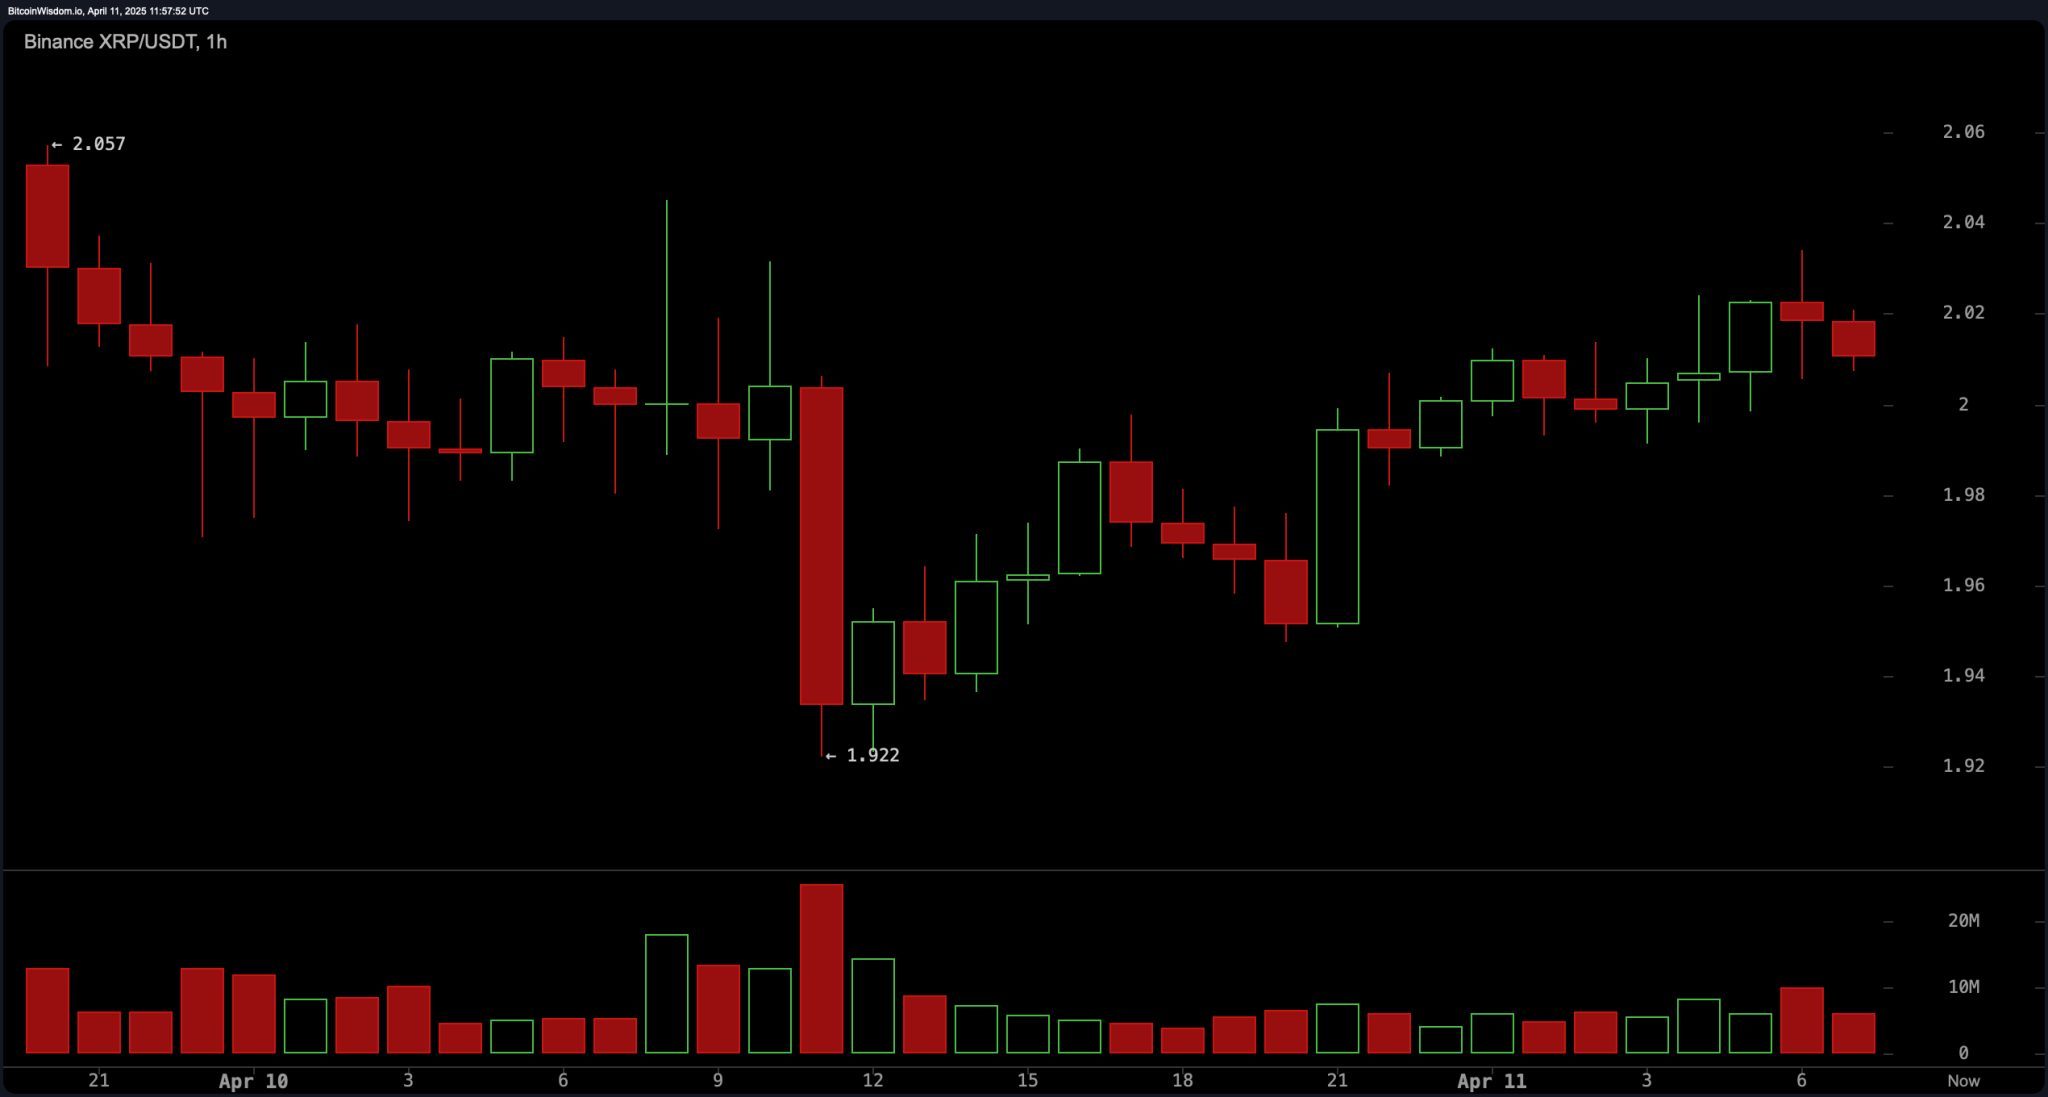
On the 1-hour chart, XRP reflects a consolidation phase with a slight bullish bias. The price has been establishing higher lows since bouncing off the $1.92 level, suggesting a gradual accumulation. Candlestick formations in this range hint at steady buying interest, although volume has slightly declined. This contraction in volume, alongside the tight price channel between $2.00 and $2.03, points to a likely breakout. Should momentum carry XRP above $2.04, a quick price acceleration toward the $2.10–$2.15 zone may unfold, while any drop below $1.98 would invalidate the immediate bullish thesis.
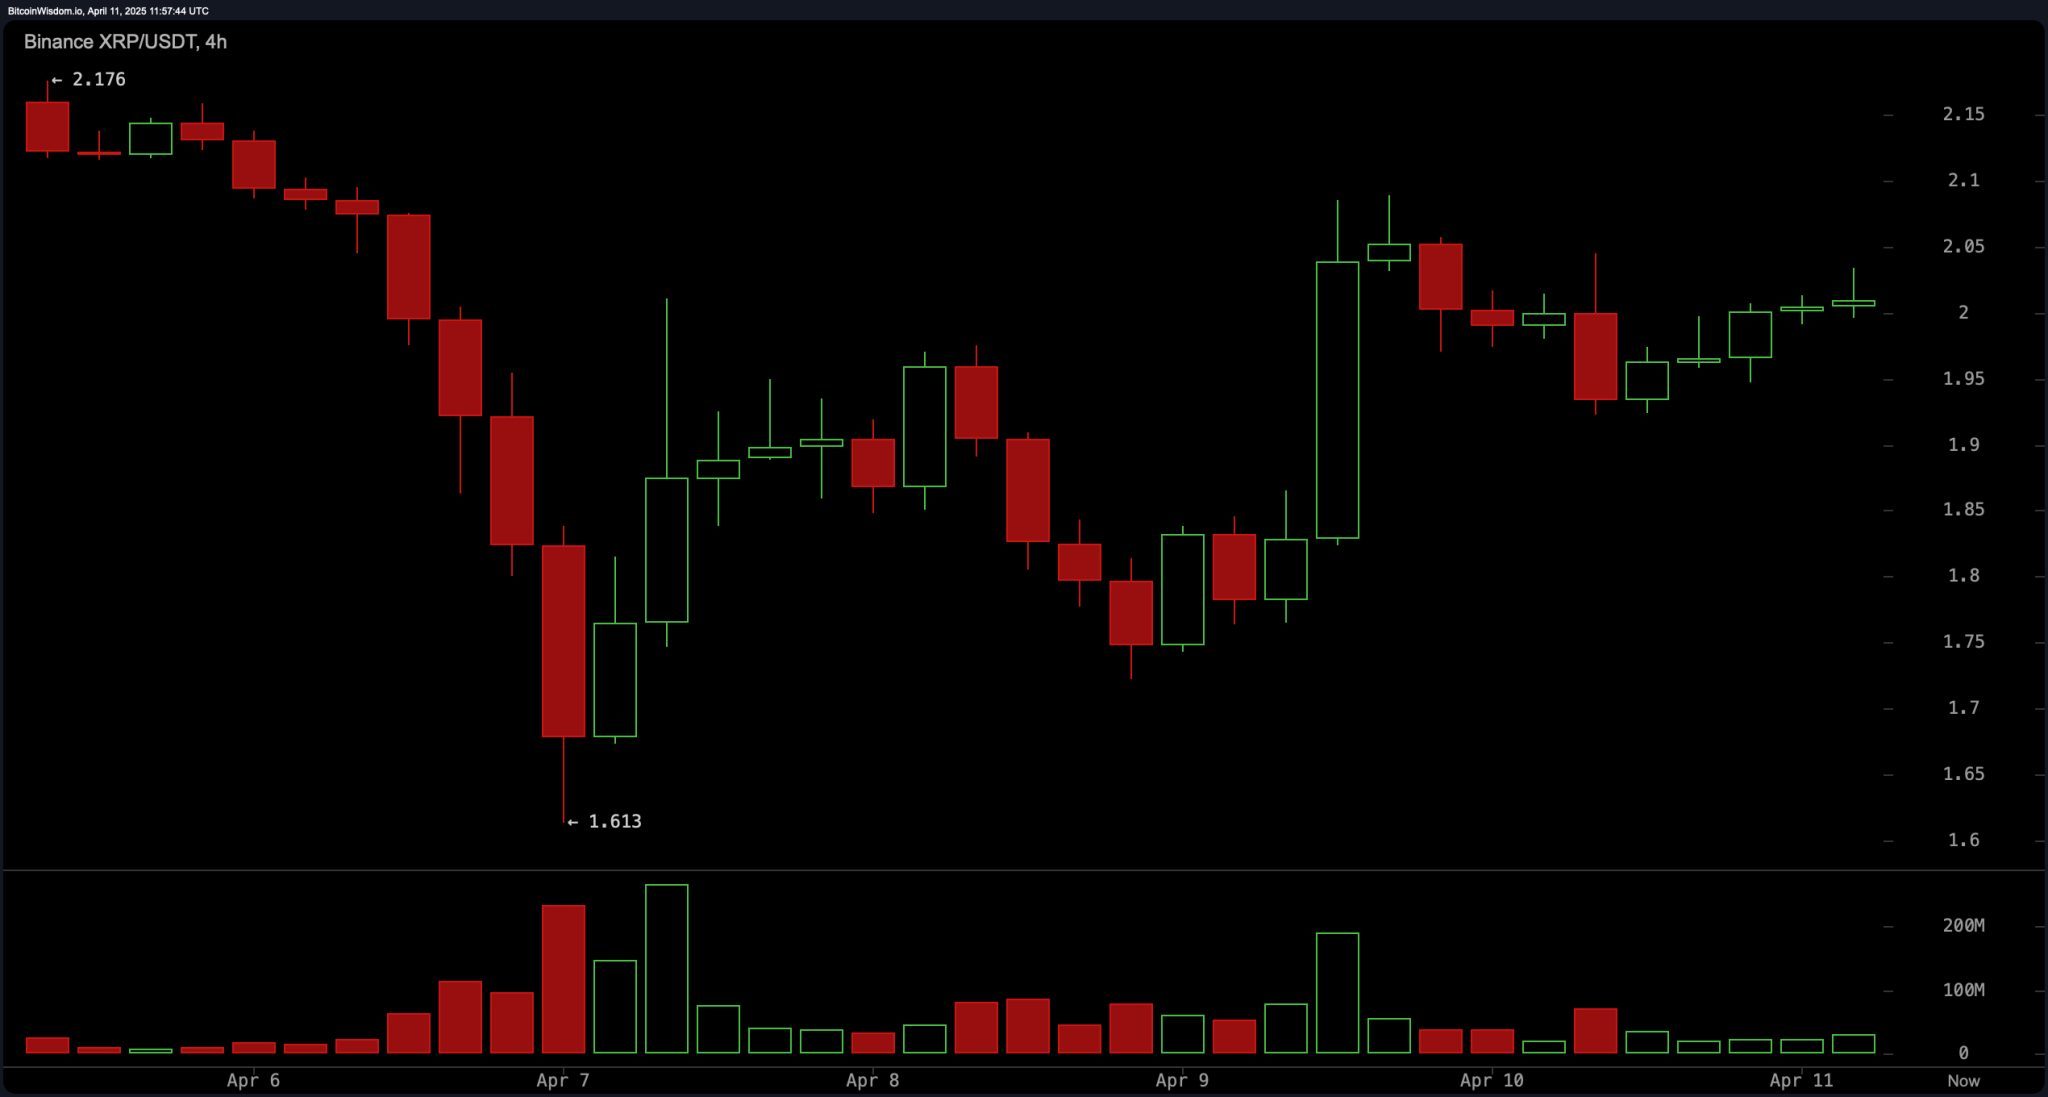
The 4-hour chart reveals a more pronounced recovery trajectory following a sharp decline to $1.613. Since that drop, XRP has formed a series of higher lows and is now testing the $2.10 resistance level. Notably, buying volume has increased on green candles, underscoring positive momentum. A bullish pennant or ascending triangle appears to be shaping, signaling potential for continuation. A confirmed breakout above the $2.12–$2.15 resistance range could trigger a medium-term rally, while failure to hold the $1.95 support area may open the door to renewed downside pressure.
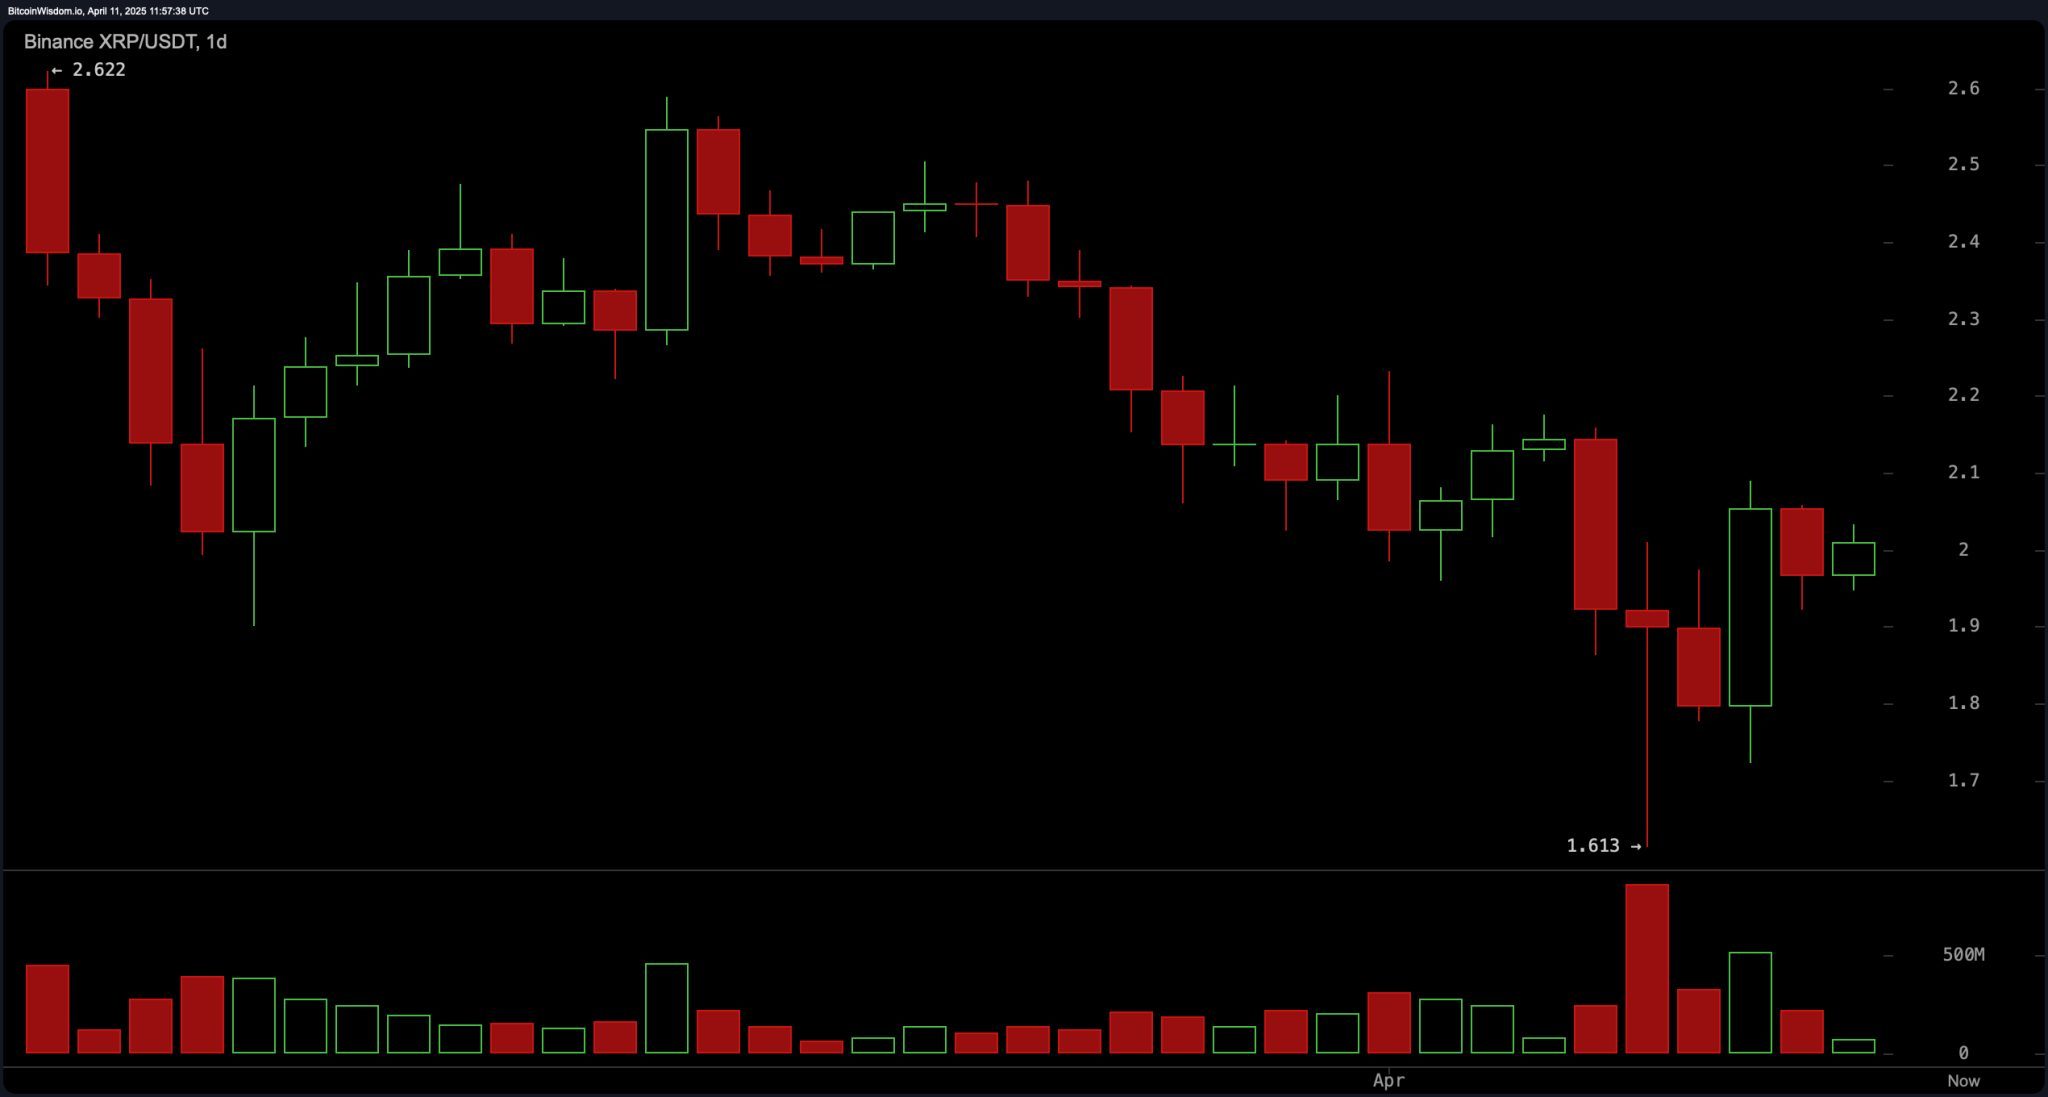
From the daily perspective, XRP remains within a broader bearish macro channel, yet signs of a base formation are surfacing. After falling to $1.613 in a capitulatory move, the price rebounded with strong volume—often a hallmark of seller exhaustion. While resistance at the $2.10–$2.15 range continues to cap advances, a sustained close above $2.20, supported by healthy volume, would mark a significant structural shift toward bullish territory. Conversely, a return below $1.90 could resume the downward trend, potentially retesting the recent low.
Oscillators currently indicate a predominantly neutral sentiment with a mild tilt toward bearish momentum. The relative strength index (RSI) at 44.14, Stochastic at 56.36, commodity channel index (CCI) at -63.77, and average directional index (ADX) at 24.81 all suggest indecision, lacking a strong trend signal. The awesome oscillator is also neutral at -0.29279. However, the momentum oscillator stands out with a bearish reading of -0.12872, supported by the moving average convergence divergence (MACD) at -0.10527, which likewise registers a negative signal. These conditions reflect a market in transition, awaiting a definitive breakout or breakdown.
Moving averages present a mixed yet largely bearish outlook. The 10-period exponential moving average (EMA) at $2.01591 has crossed below the 10-period simple moving average (SMA) at $1.99993, signaling short-term indecision. From the 20-period to the 100-period levels, both EMA and SMA indicate sell actions, with the 50-period EMA and SMA at $2.24742 and $2.27117, respectively, further reinforcing the downward bias. However, the longer-term 200-period EMA and SMA, at $1.94894 and $1.87339, respectively, continue to flash bullish signals, suggesting that despite near-term pressure, the macro trend may yet favor bulls if support levels hold.
Bull Verdict:
If XRP maintains support above $1.95 and successfully breaks through the $2.12–$2.20 resistance zone with convincing volume, the technical structure supports a bullish continuation. The formation of higher lows across timeframes and signs of seller exhaustion on the daily chart suggest a potential breakout toward $2.30 or higher in the coming sessions.
Bear Verdict:
Should XRP fail to sustain the $1.95 support and drop below the critical $1.90 level, bearish momentum is likely to resume. This would confirm a breakdown from current consolidation patterns and could prompt a retest of the $1.613 capitulation low, reasserting the macro downtrend.