
XRP is trading at $2.20 with a market capitalization of $127 billion, a 24-hour global trade volume of $5.43 billion, and an intraday price range between $2.16 and $2.27, indicating consolidation near key support levels as the cryptocurrency navigates a broader downtrend across multiple timeframes.

XRP
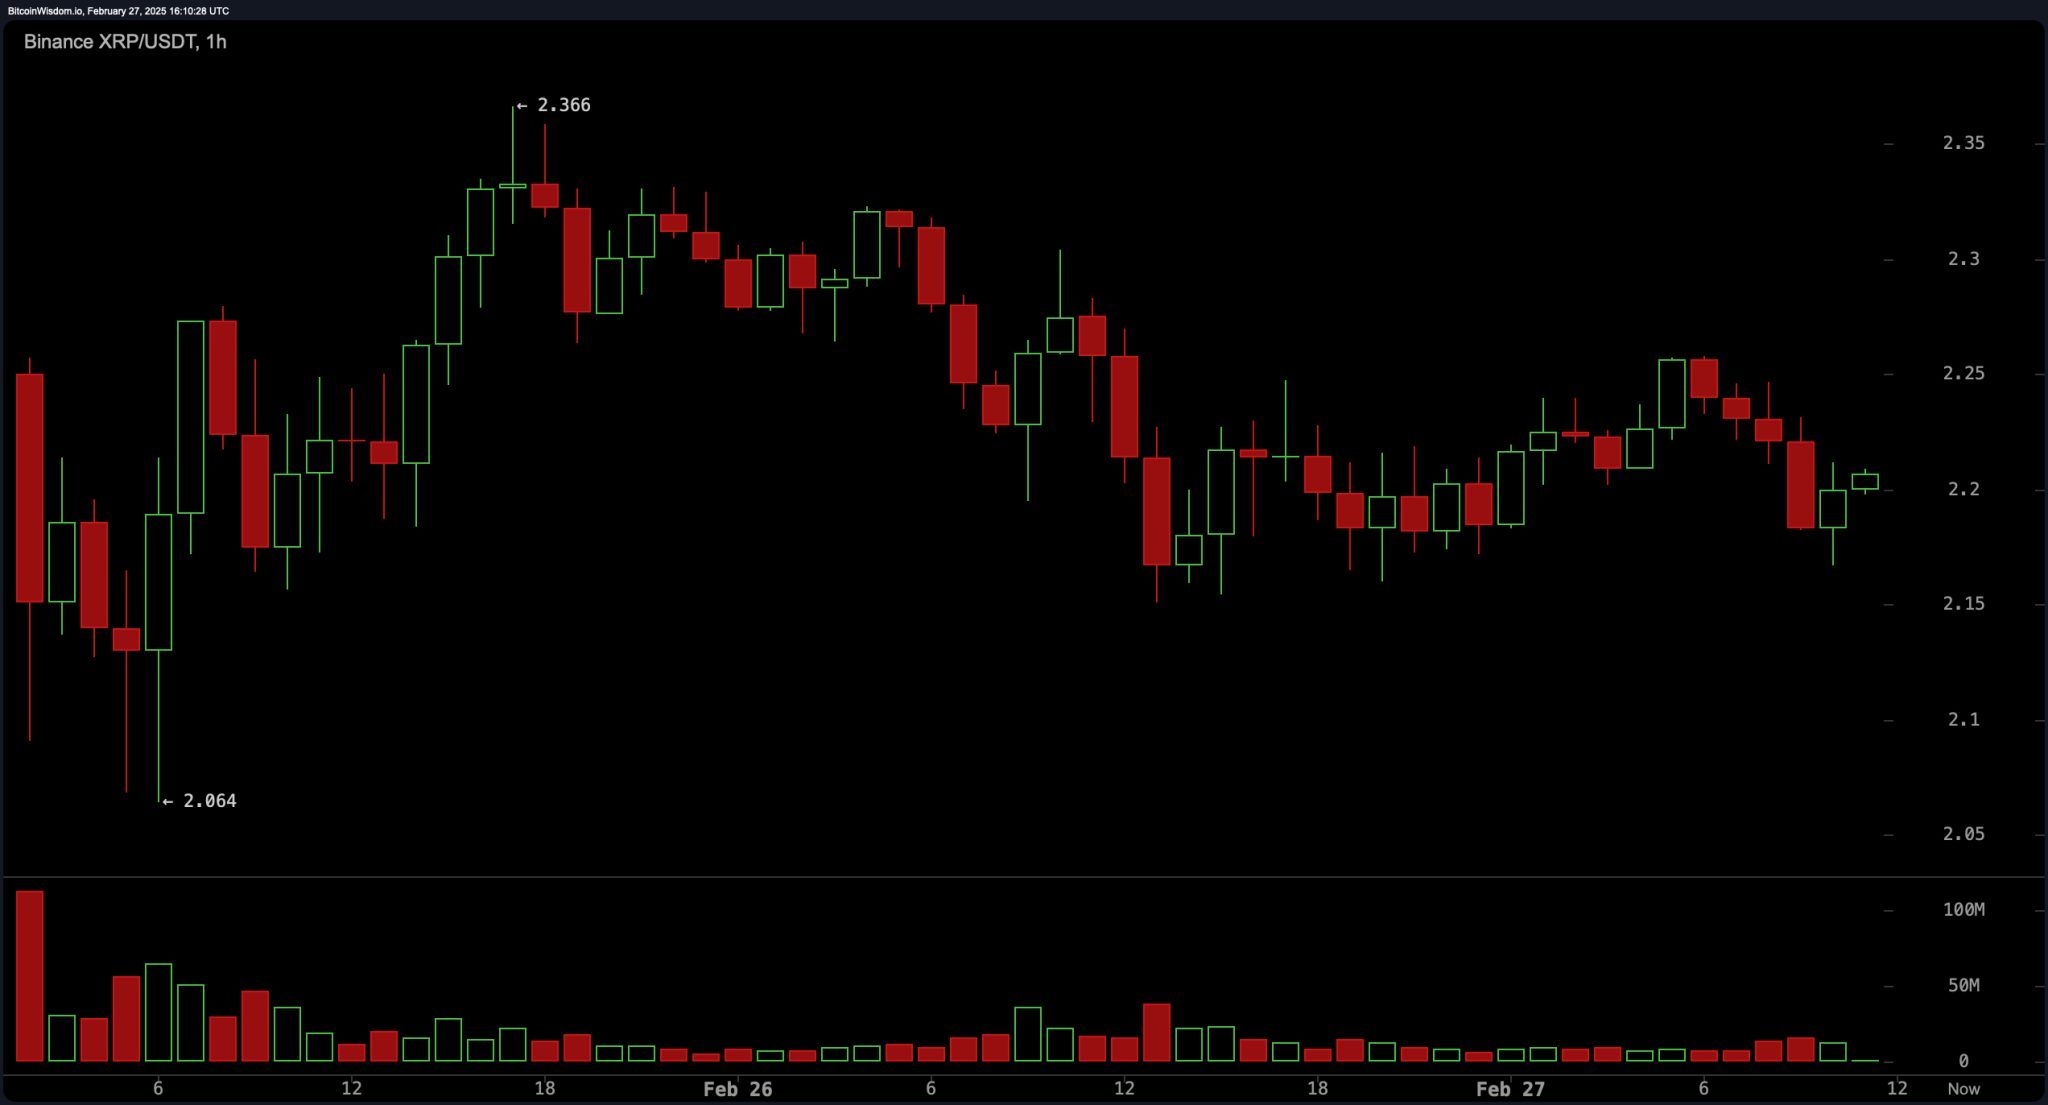
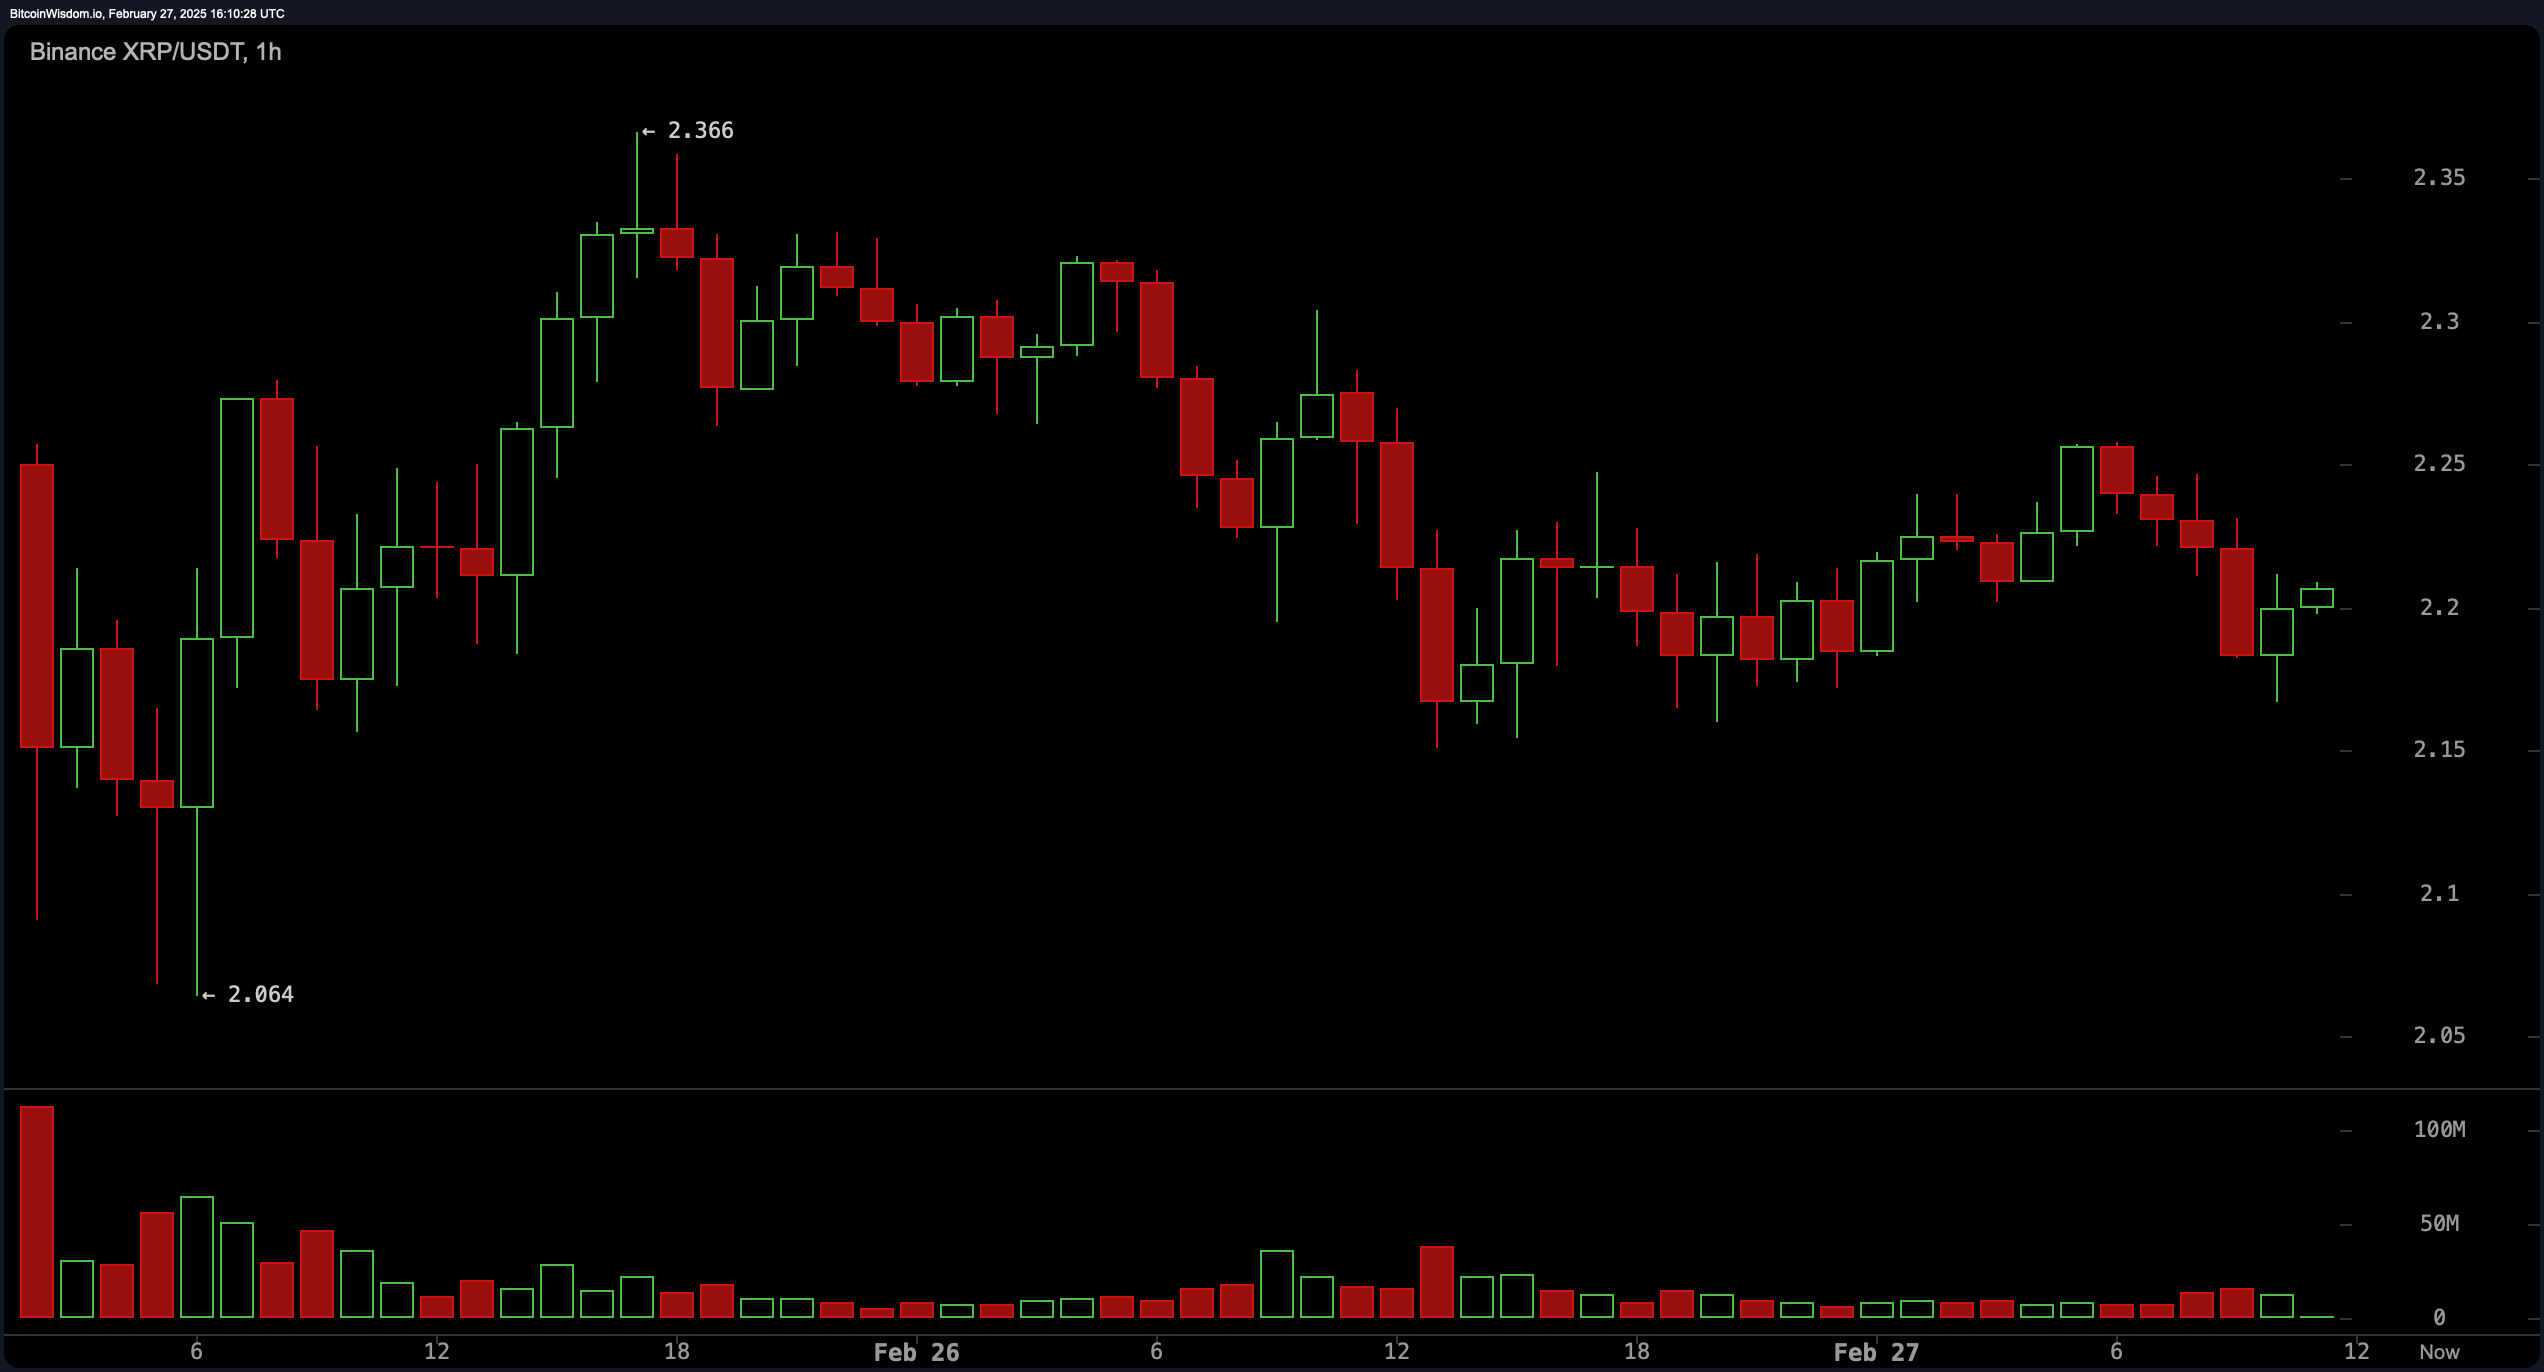
On the one-hour chart, XRP remains in a tight range following a significant sell-off, with price action consolidating near short-term support at $2.064. The chart shows a lack of strong buying pressure, and a declining volume suggests indecision in the market. Short-term resistance at $2.366 remains untested, and the price has failed to establish higher highs. A breakout above $2.25 with strong volume could push the price towards $2.3–$2.35, while a breakdown below $2.15 could trigger further declines.
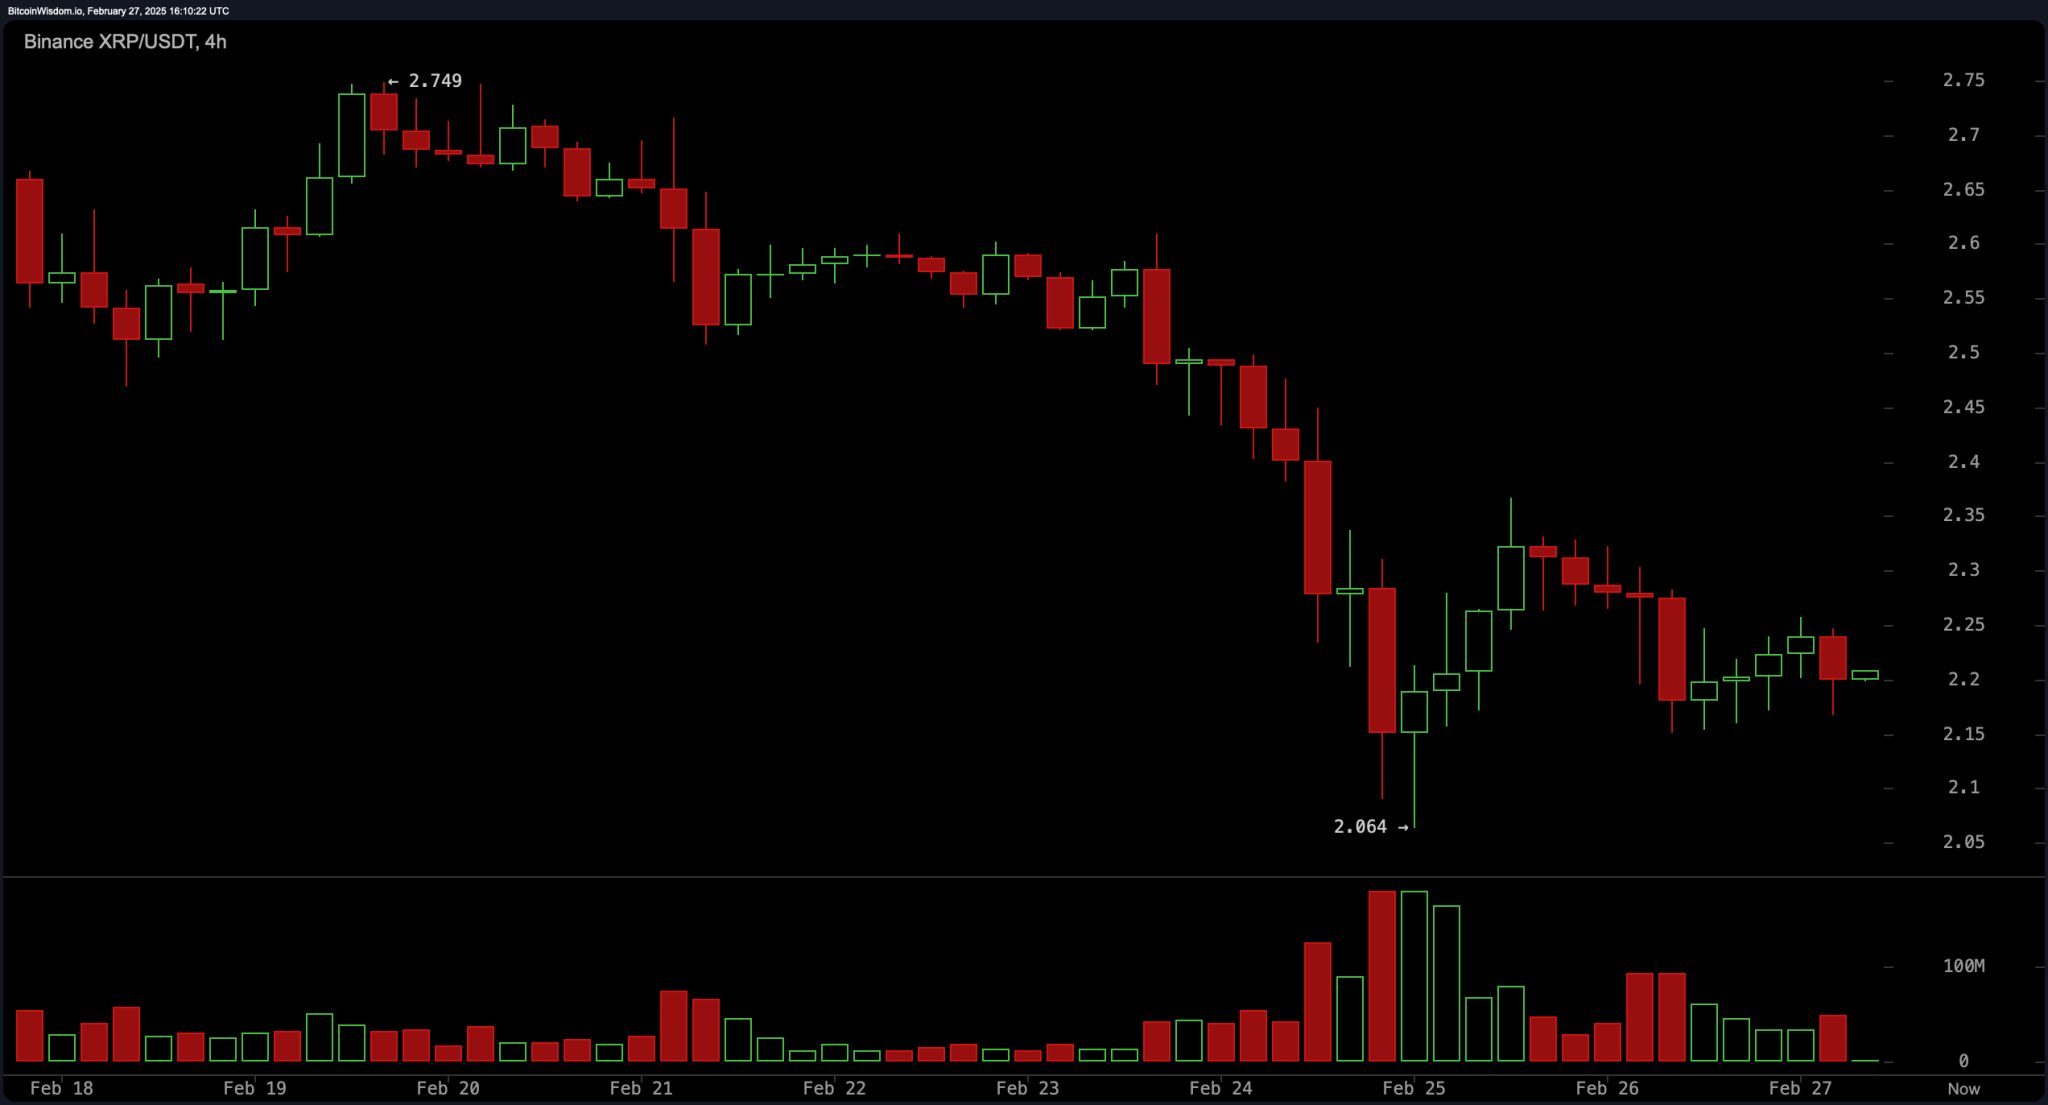
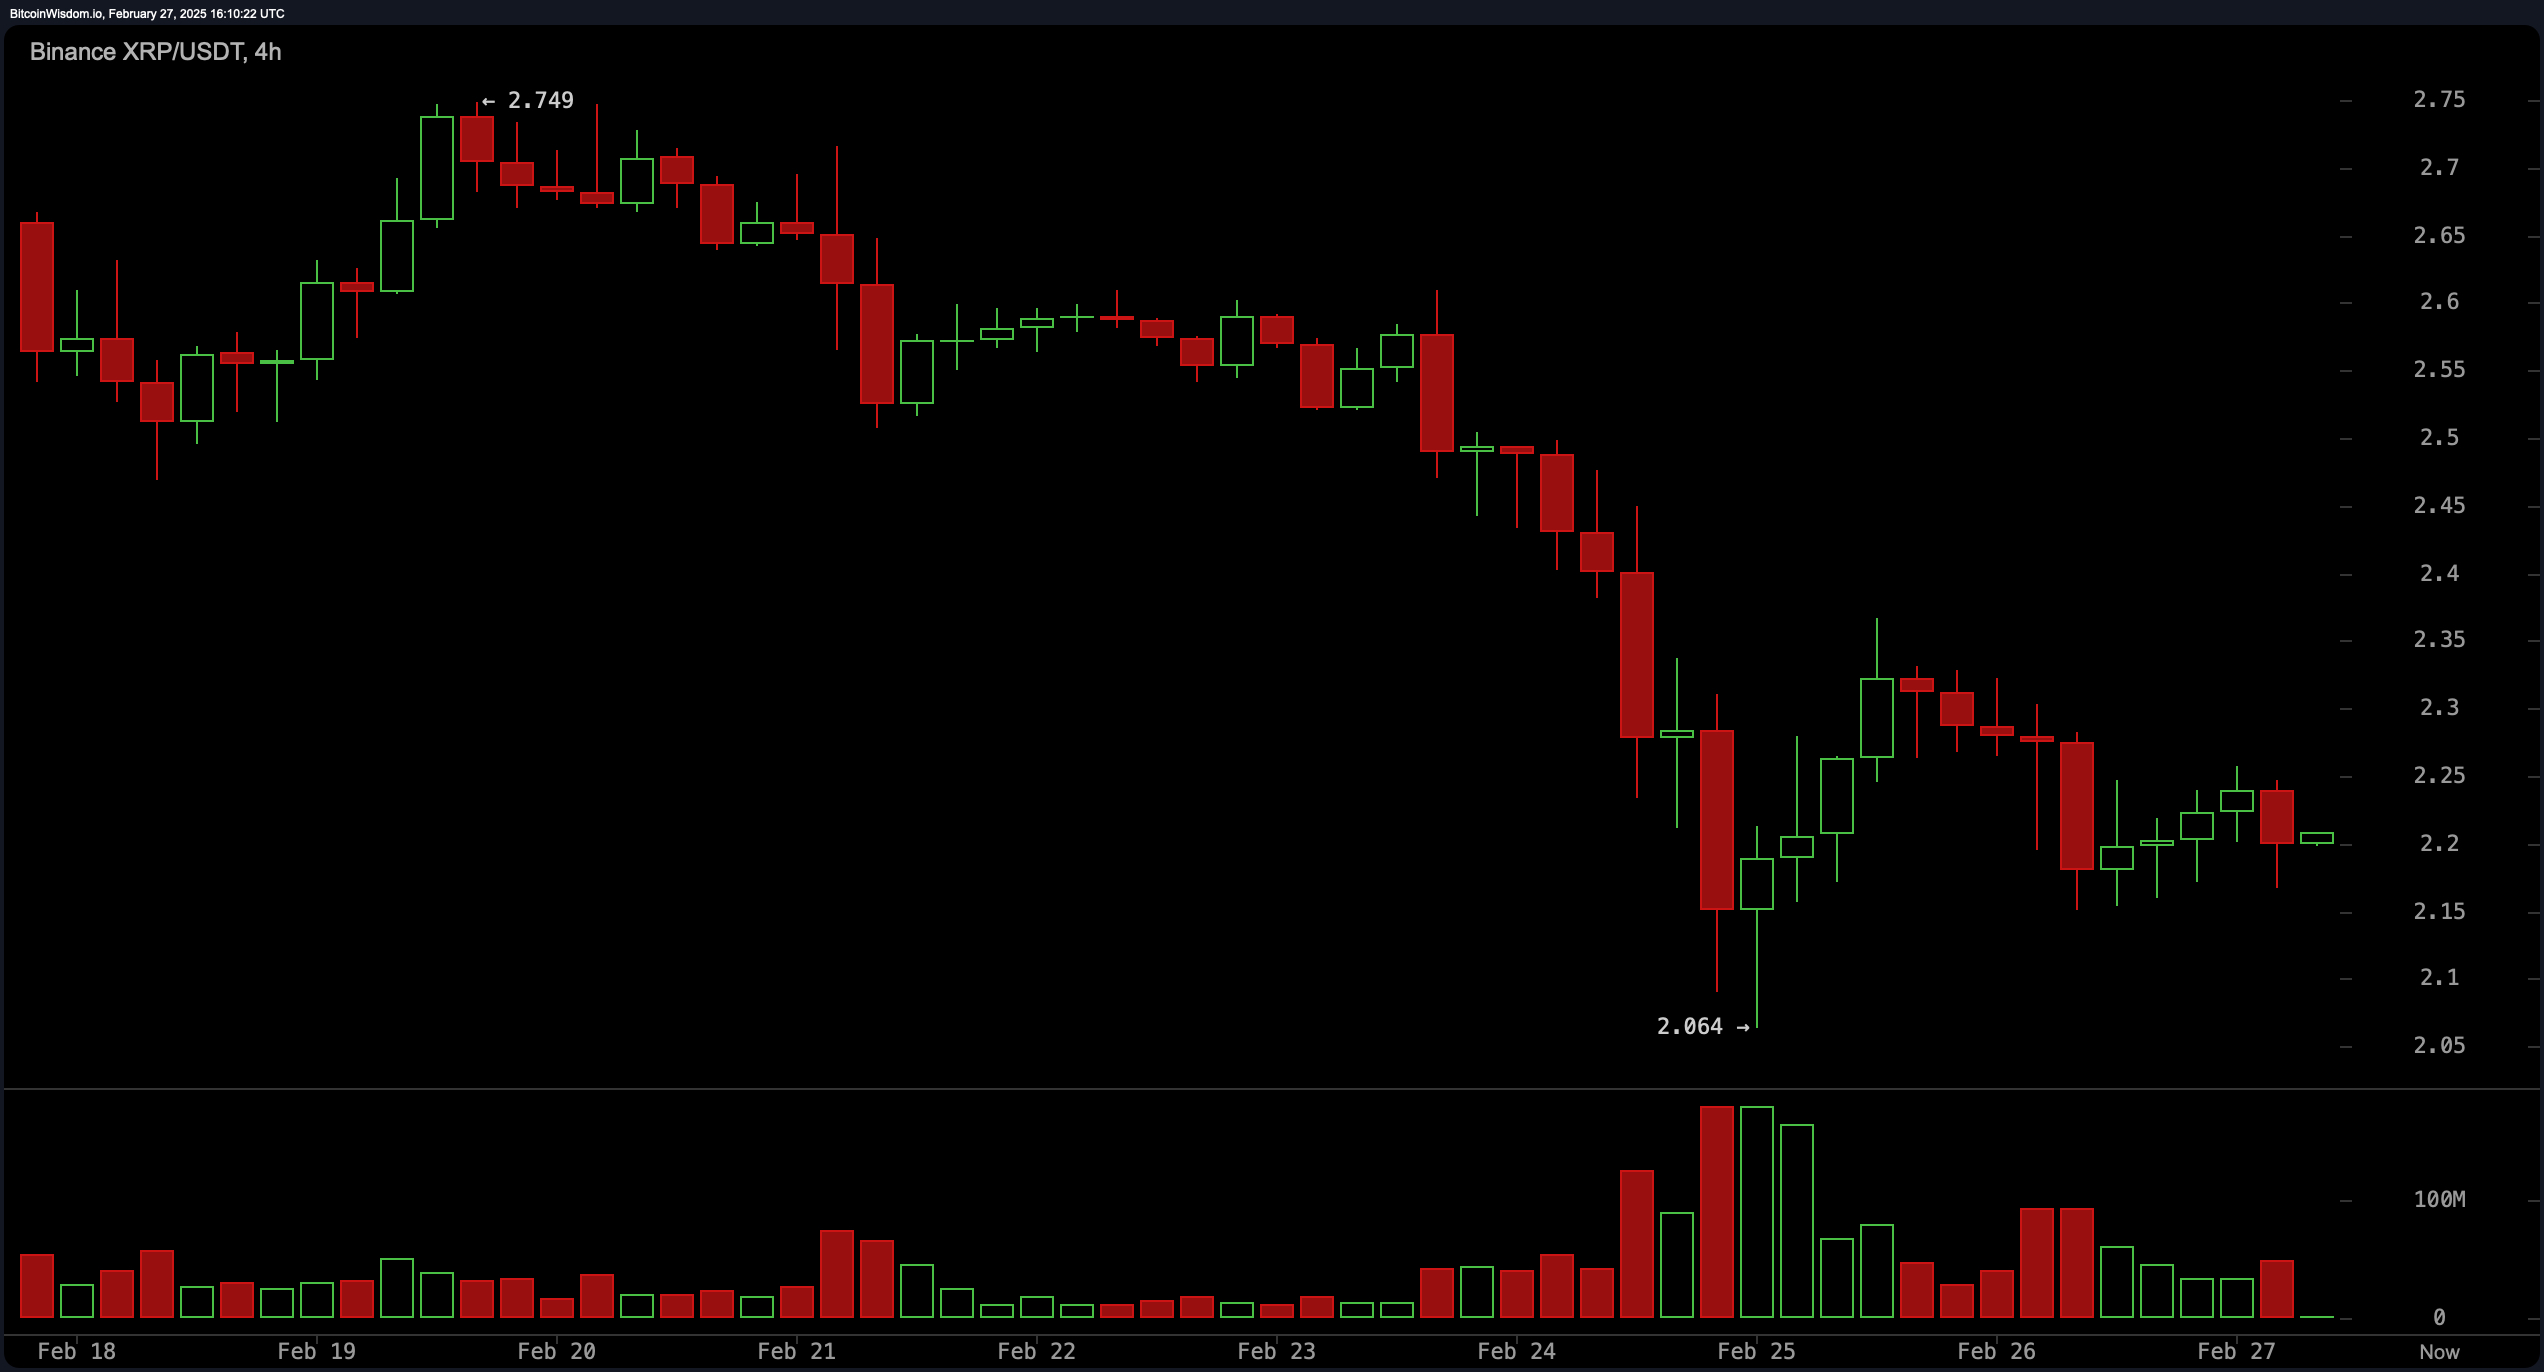
The four-hour chart presents a broader perspective on XRP’s recent weakness, showing a bearish trend that intensified after a failed breakout near $2.75. The price has since retreated and is hovering around $2.2, a critical level that could determine its next move. The lack of momentum suggests that XRP may continue to trade sideways unless it reclaims $2.3 with substantial buying volume. If sellers regain control, the next key support is at $2.064, with a potential downside extension towards $2.0.
XRP Price Watch: $2.20 Becomes the Battleground for Bulls and Bears
XRP is trading at $2.20 with a market capitalization of $127 billion, a 24-hour global trade volume of $5.43 billion, and an intraday price range between $2.16 and $2.27, indicating consolidation near key support levels as the cryptocurrency navigates a broader downtrend across multiple timeframes.
XRP
On the one-hour chart, XRP remains in a tight range following a significant sell-off, with price action consolidating near short-term support at $2.064. The chart shows a lack of strong buying pressure, and a declining volume suggests indecision in the market. Short-term resistance at $2.366 remains untested, and the price has failed to establish higher highs. A breakout above $2.25 with strong volume could push the price towards $2.3–$2.35, while a breakdown below $2.15 could trigger further declines.
The four-hour chart presents a broader perspective on XRP’s recent weakness, showing a bearish trend that intensified after a failed breakout near $2.75. The price has since retreated and is hovering around $2.2, a critical level that could determine its next move. The lack of momentum suggests that XRP may continue to trade sideways unless it reclaims $2.3 with substantial buying volume. If sellers regain control, the next key support is at $2.064, with a potential downside extension towards $2.0.
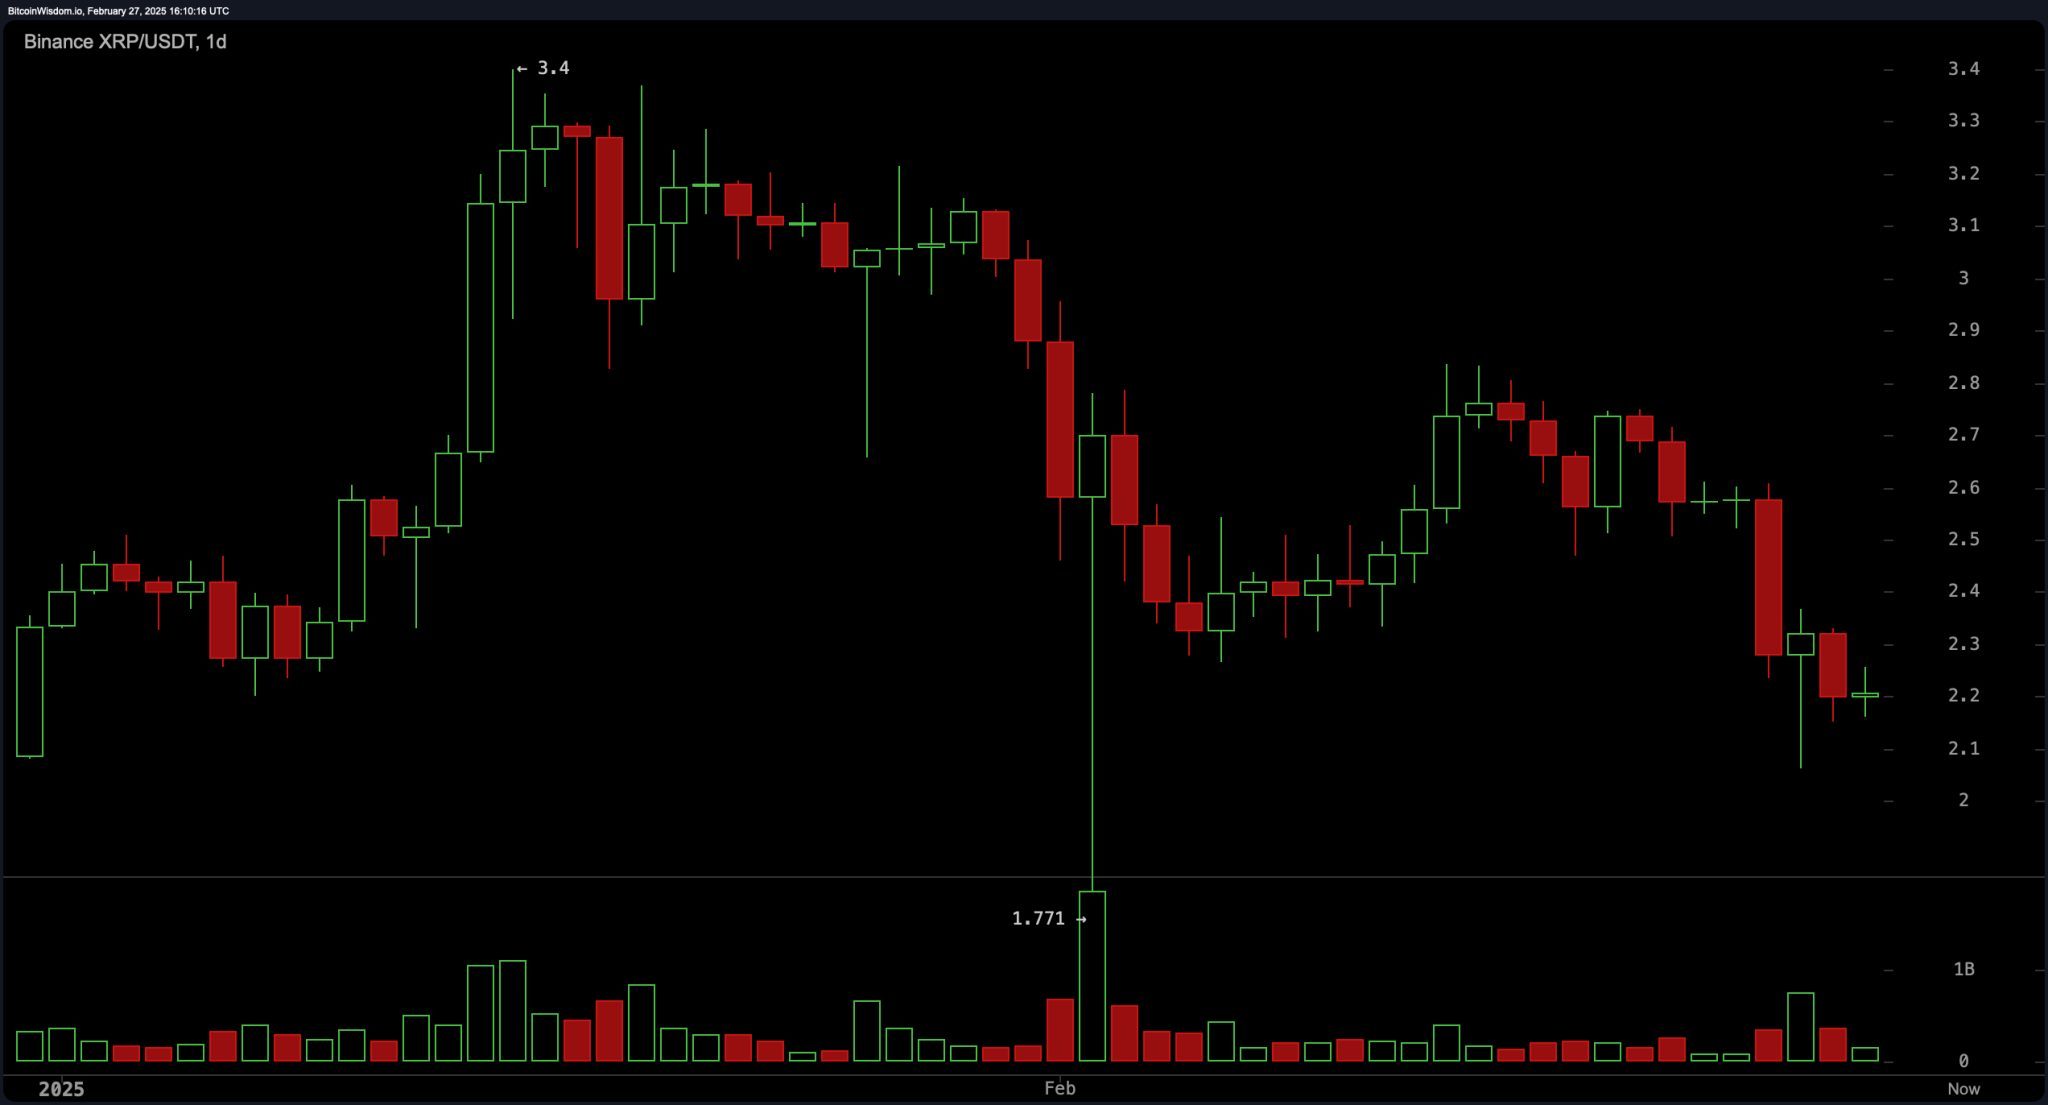
On the daily chart, XRP continues to exhibit a pattern of lower highs and lower lows, reinforcing a long-term bearish structure. Resistance at $3.4 remains a distant target, while support at $2.2 has become a crucial level for potential buyers. A previous volume spike around $1.77 signals a strong buy zone, but current momentum remains weak. A recovery scenario would require XRP to establish a higher low above $2.2 and break through resistance levels around $2.6–$2.8. If bearish pressure persists, a drop below $2.1 could expose lower price levels.
The daily chart shows XRP’s oscillators provide mixed signals, with the relative strength index (RSI) at 34.53 indicating neutral conditions, while the Stochastic at 22.67 also remains neutral. The commodity channel index (CCI) at -139.42 and momentum indicator at -0.45 suggest a potential buying opportunity, though the moving average convergence divergence (MACD) level at -0.103 signals bearish momentum. The awesome oscillator remains neutral, while the average directional index (ADX) at 35.26 suggests a trend is in place but lacks strong directionality.
Moving averages reinforce XRP’s prevailing bearish sentiment, with multiple exponential moving averages (EMA) and simple moving averages (SMA) signaling sell conditions. The EMA (10) at 2.40, EMA (20) at 2.50, and EMA (50) at 2.54 all indicate downward pressure, while the SMA (10) at 2.46 and SMA (50) at 2.72 further confirm the selling trend. However, long-term moving averages offer a contrasting outlook, with the EMA (200) at 1.79 and SMA (200) at 1.51 indicating a bullish long-term perspective. Until XRP reclaims key resistance levels, the prevailing trend remains bearish.
Bull Verdict:
Despite the prevailing bearish trend, XRP’s ability to hold above $2.2 could signal a potential reversal if buyers step in with strong volume. The momentum and commodity channel index suggest underlying buying interest, and a breakout above $2.3 could pave the way for a move towards $2.6–$2.8. Long-term moving averages also indicate a bullish foundation, supporting the possibility of a rebound if market conditions improve.
Bear Verdict:
XRP remains in a firm downtrend across all timeframes, with consistent lower highs and weak momentum. The moving average convergence divergence (MACD) and multiple moving averages confirm bearish pressure, while the failure to break above $2.3 suggests limited upside potential. A breakdown below $2.15 could accelerate selling towards $2.0 or lower, reinforcing the case for continued downside in the short to mid-term.