
XRP is trading at $2.34 with a market capitalization of $136 billion, as daily trade volume reaches $3.01 billion. The price has fluctuated between $2.29 and $2.38 in the past 24 hours, remaining 31.1% below its all-time high of $3.40. Binance, Coinbase, and Bybit dominate XRP trading, while South Korean markets show a slight premium at $2.38.

XRP
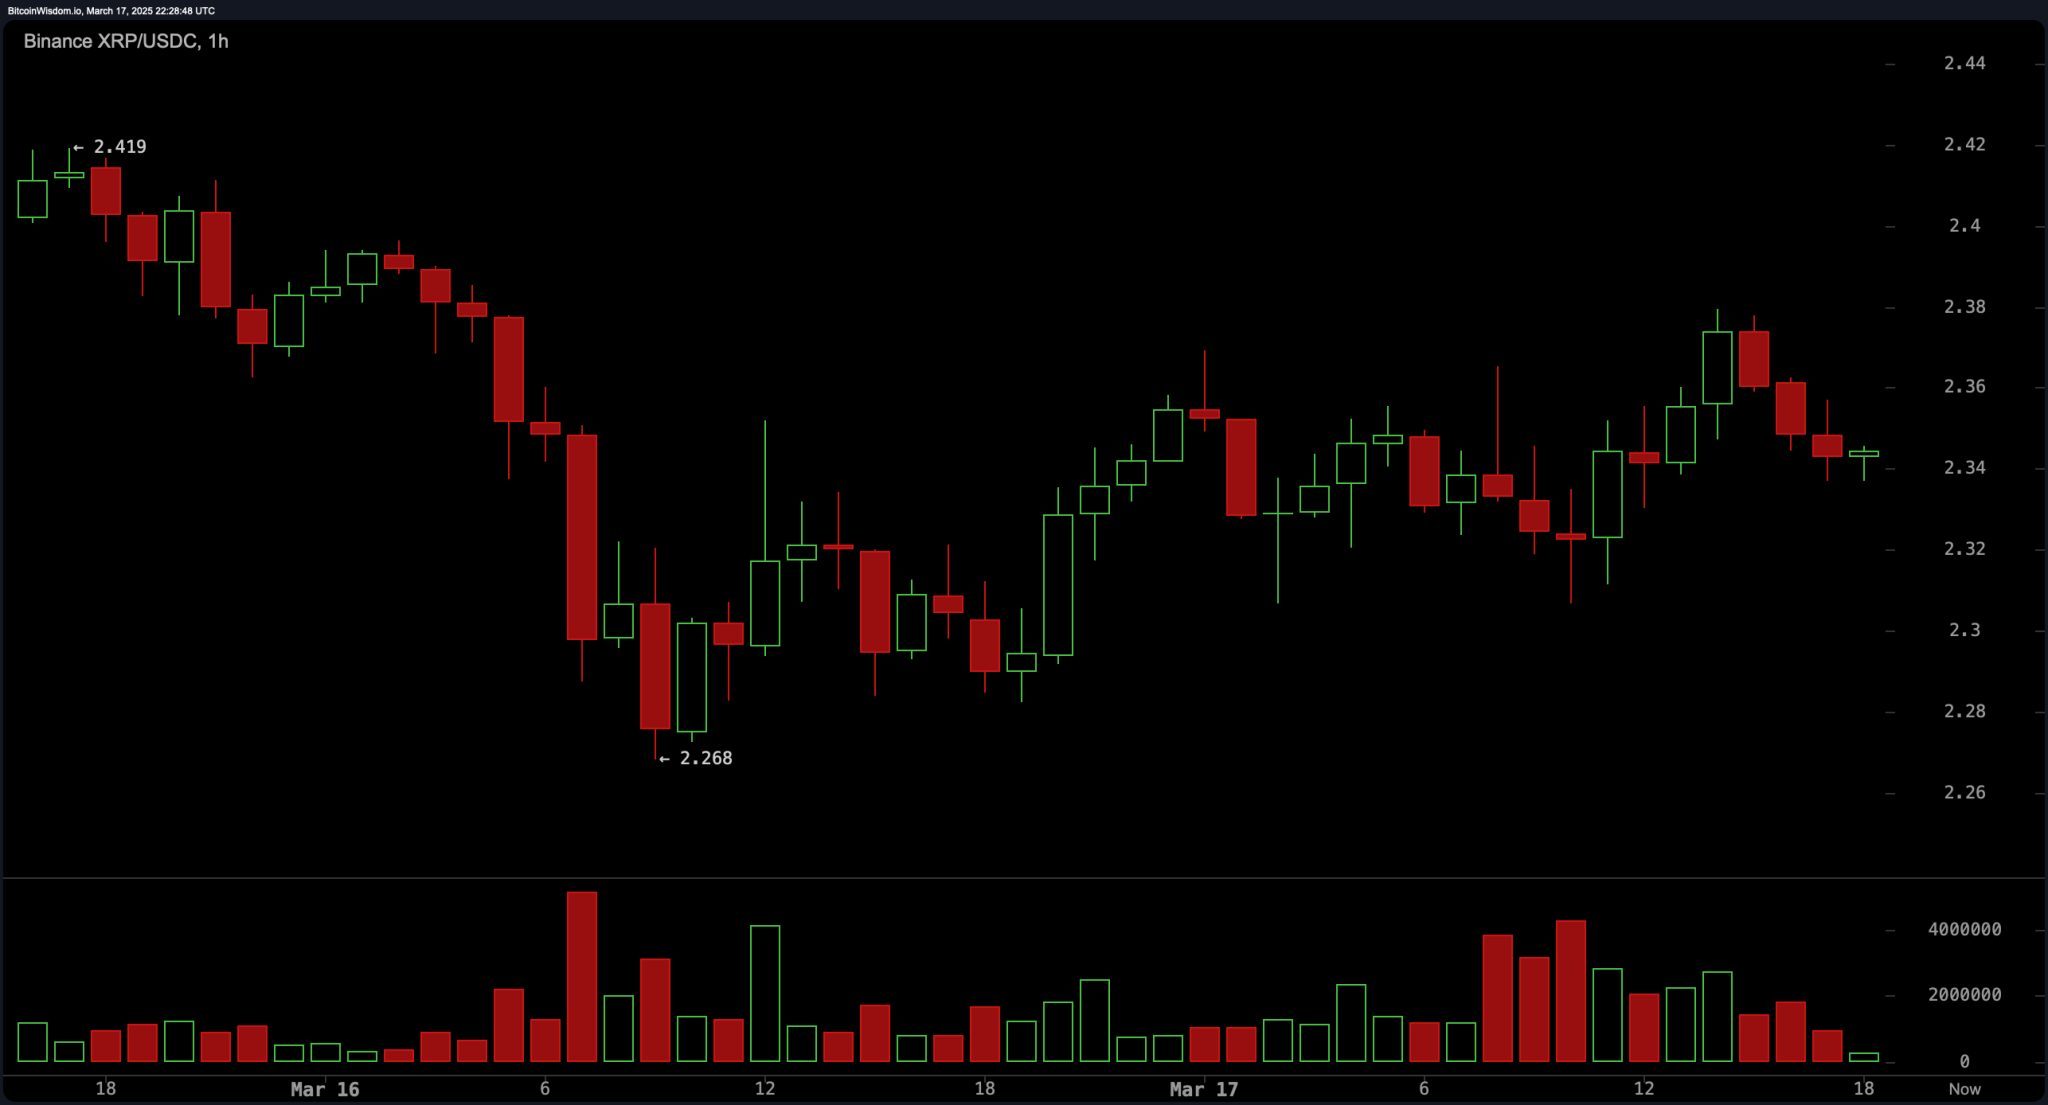
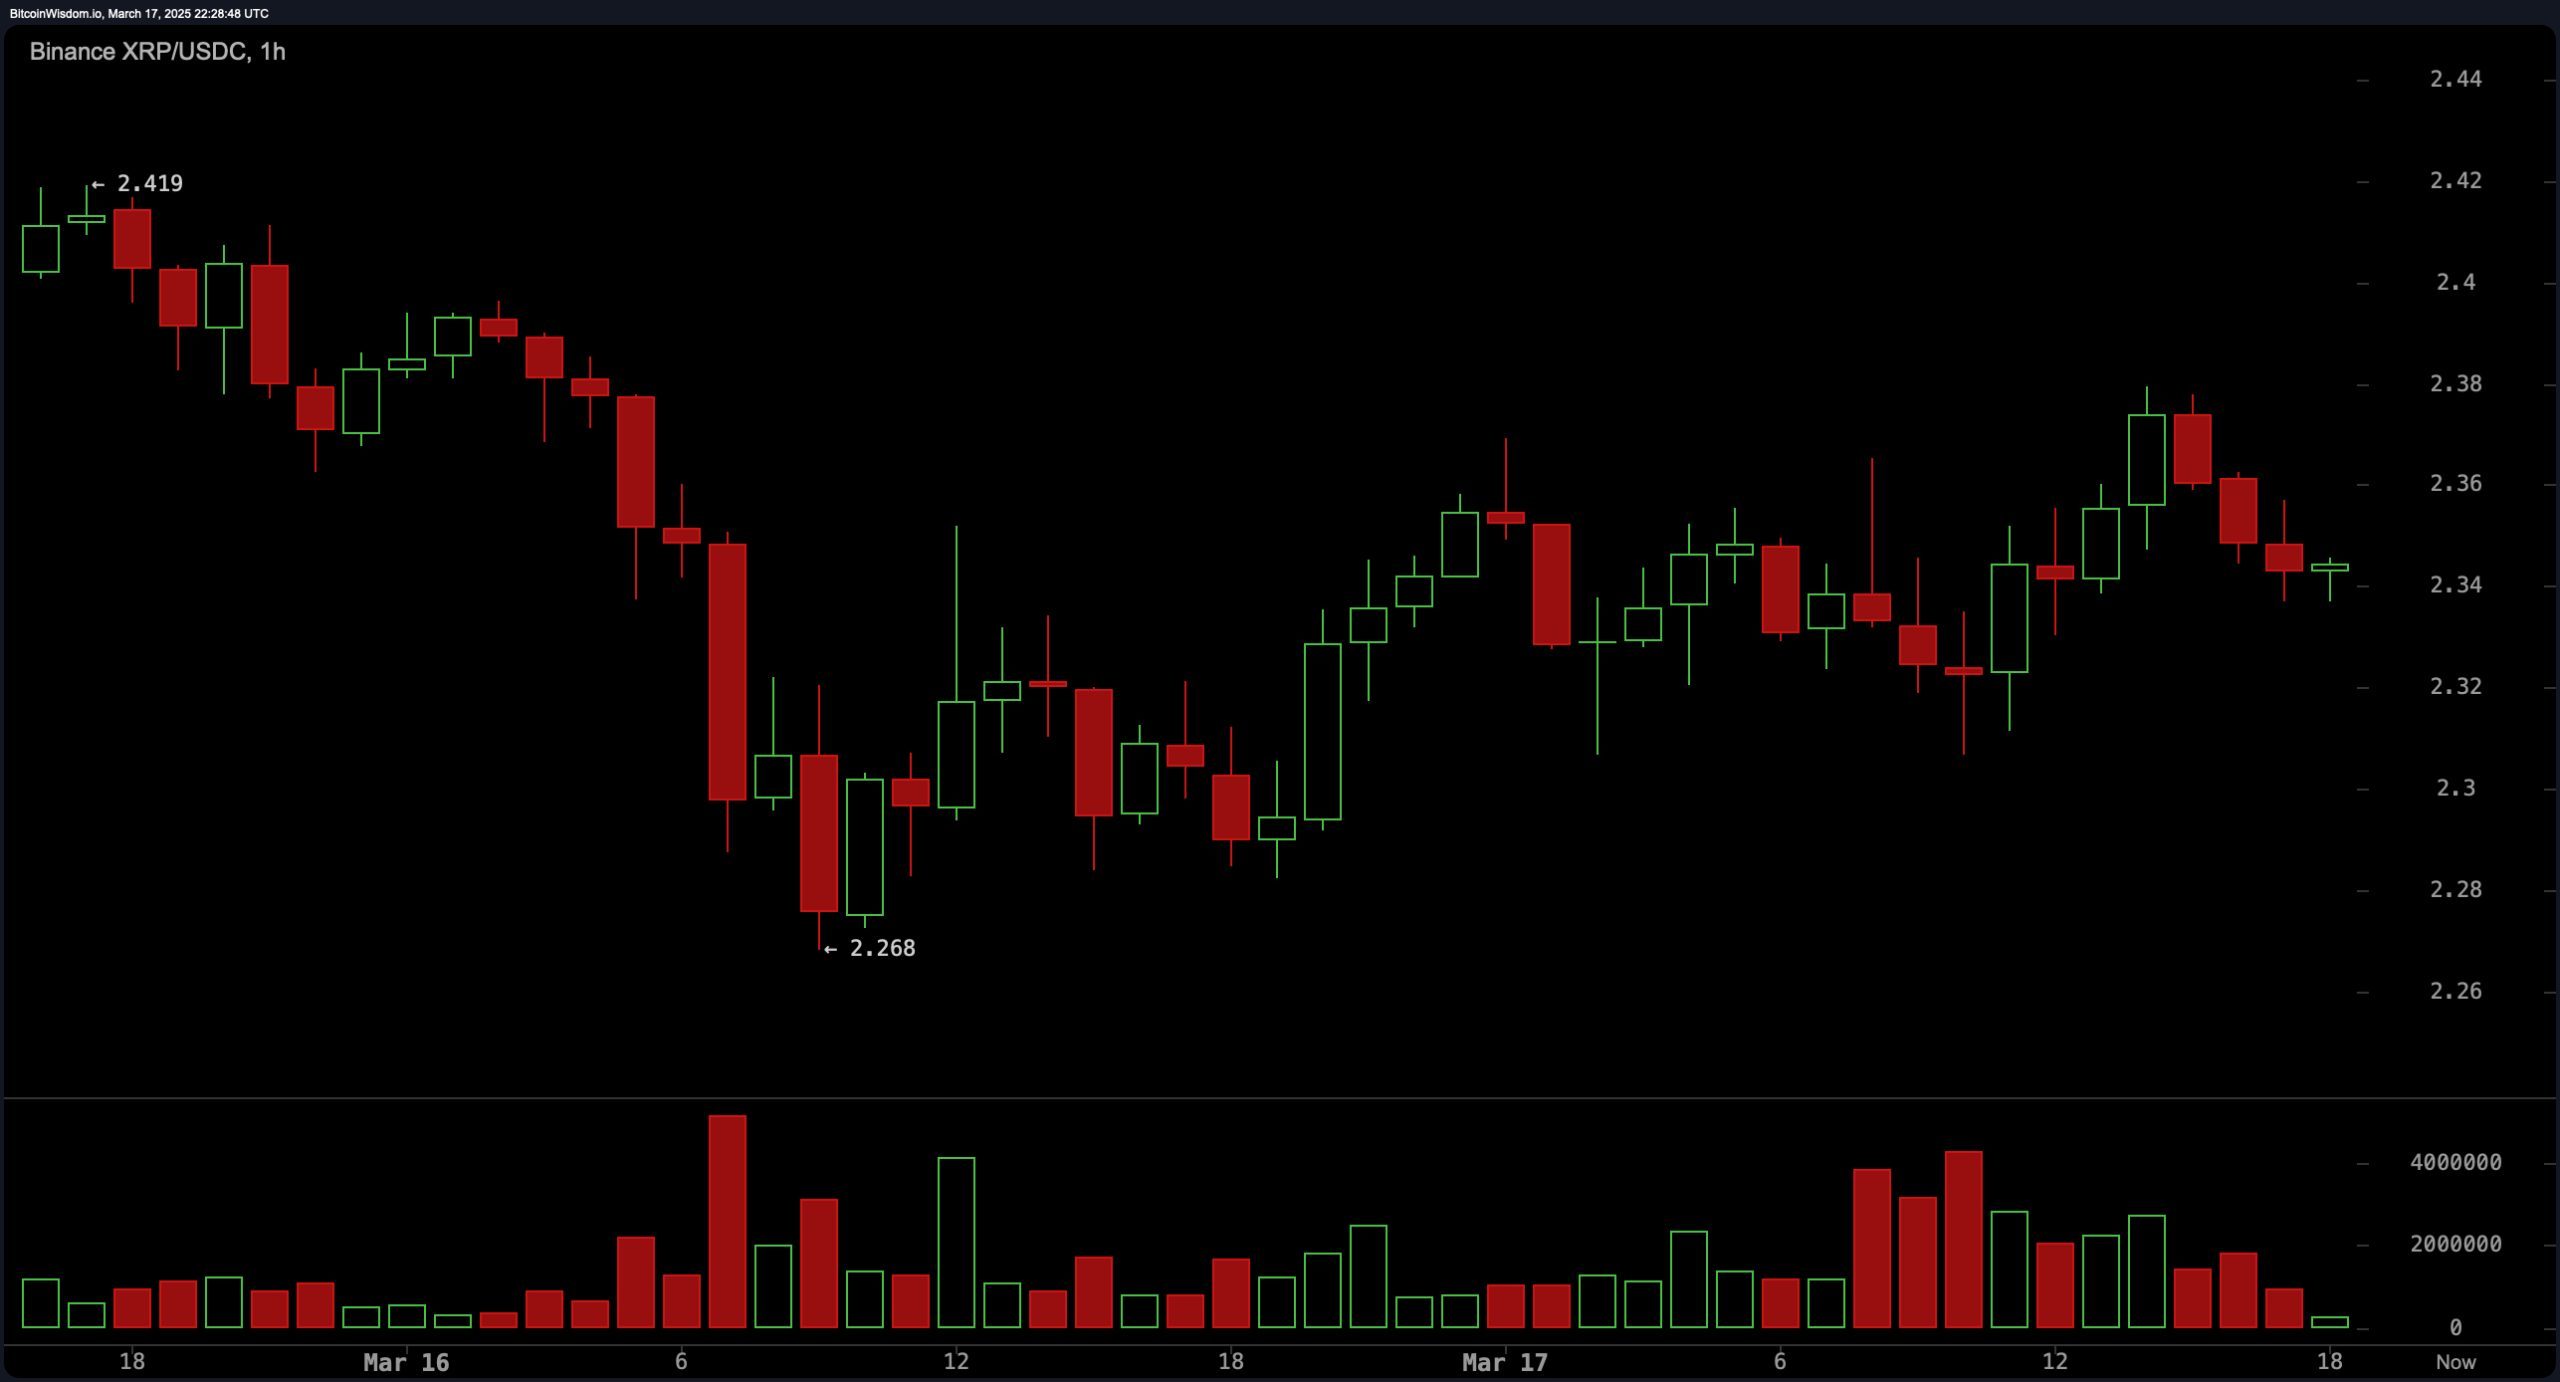
XRP’s one-hour chart signals a slightly bearish trend following a rejection at $2.44. Resistance is observed at $2.38–$2.40, with support forming at $2.27. Bearish volume has increased, hinting at short-term selling pressure. A bullish move requires a breakout above $2.38–$2.40, while a drop below $2.30 could trigger a decline toward $2.25–$2.27.
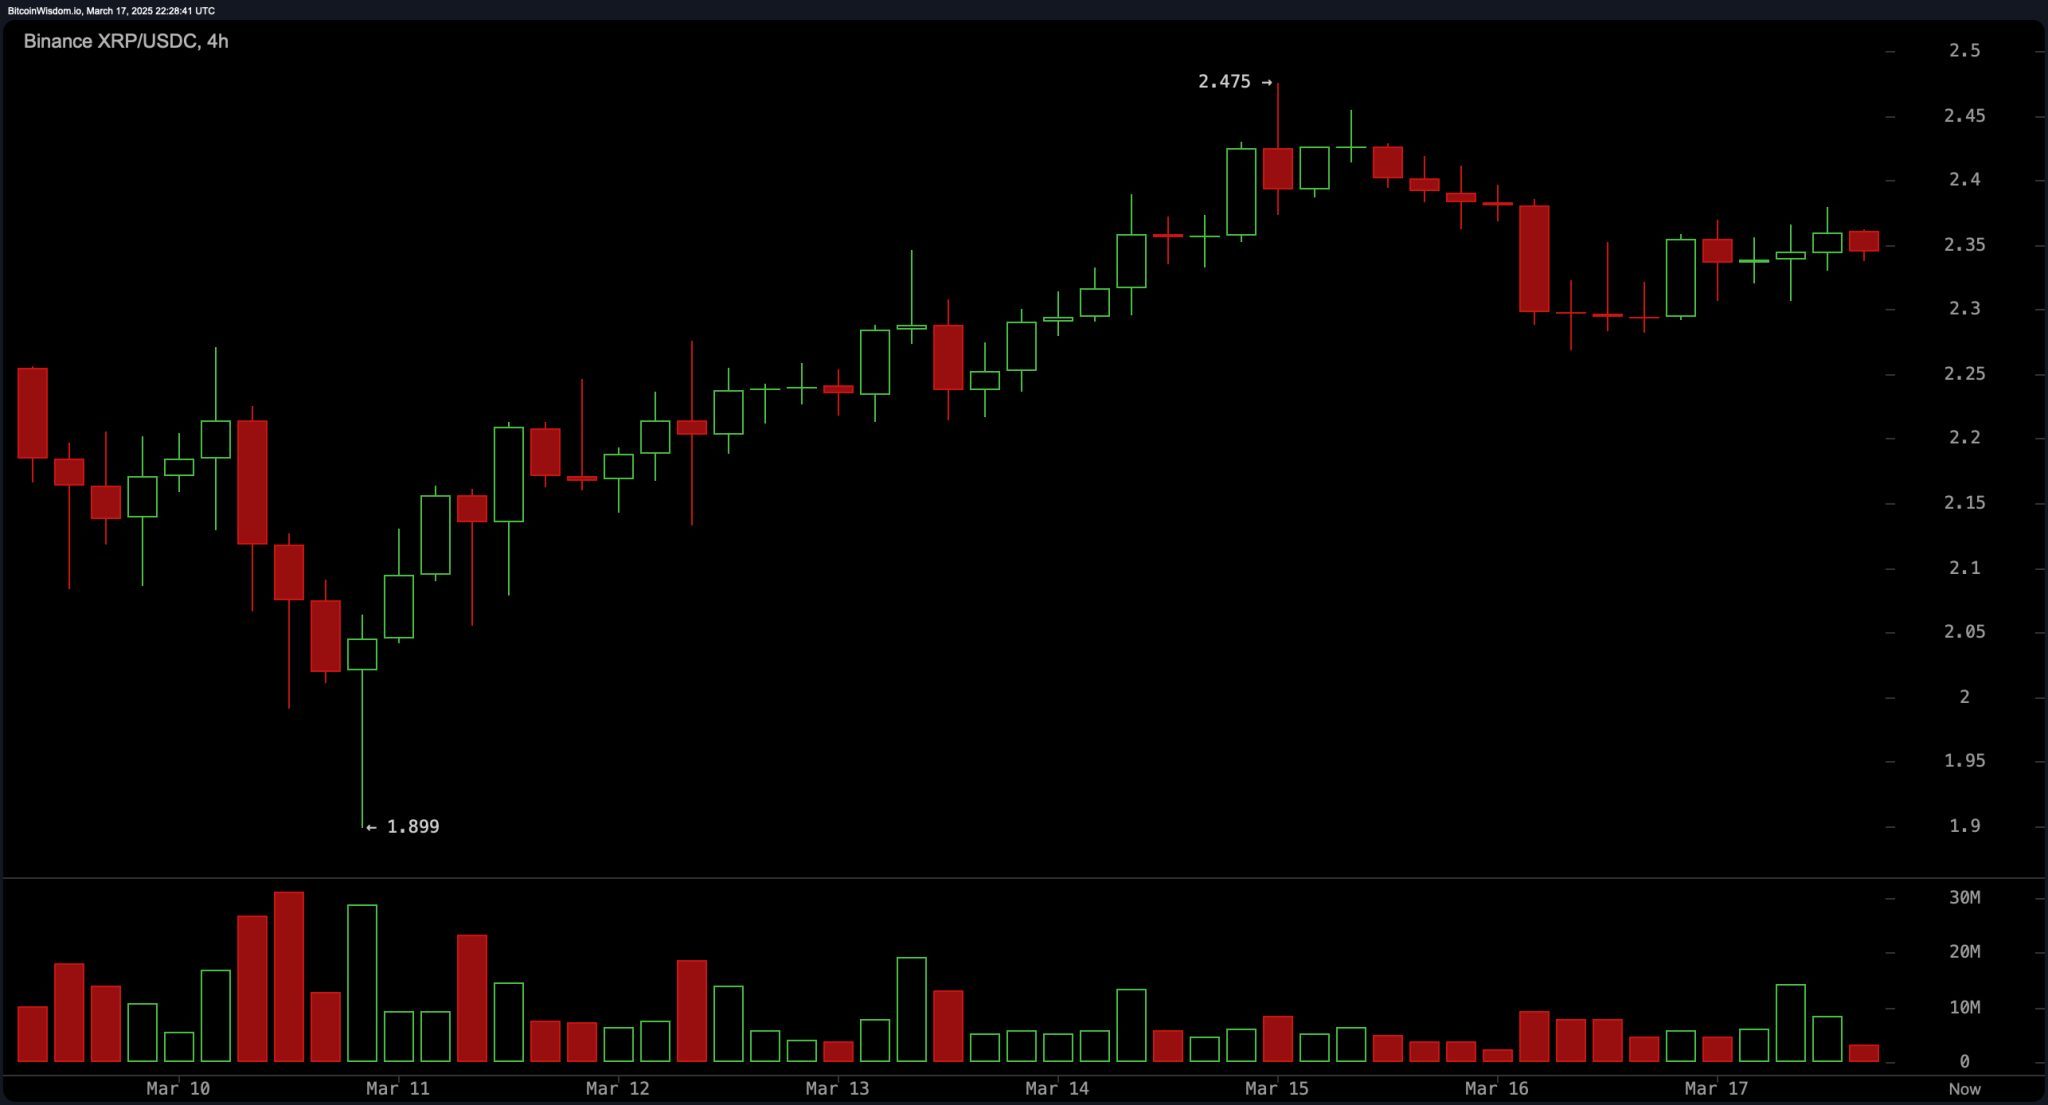
The four-hour chart reflects a short-term bullish recovery from $1.89 to $2.47, where local resistance has emerged. Buyers have consistently stepped in around $2.10–$2.20, reinforcing support in that region. Volume spikes during the uptrend indicate strong momentum, with a potential push above $2.47 leading to a test of $2.60–$2.70. A decline below $2.30 may suggest a return to the $2.10–$2.20 support zone.
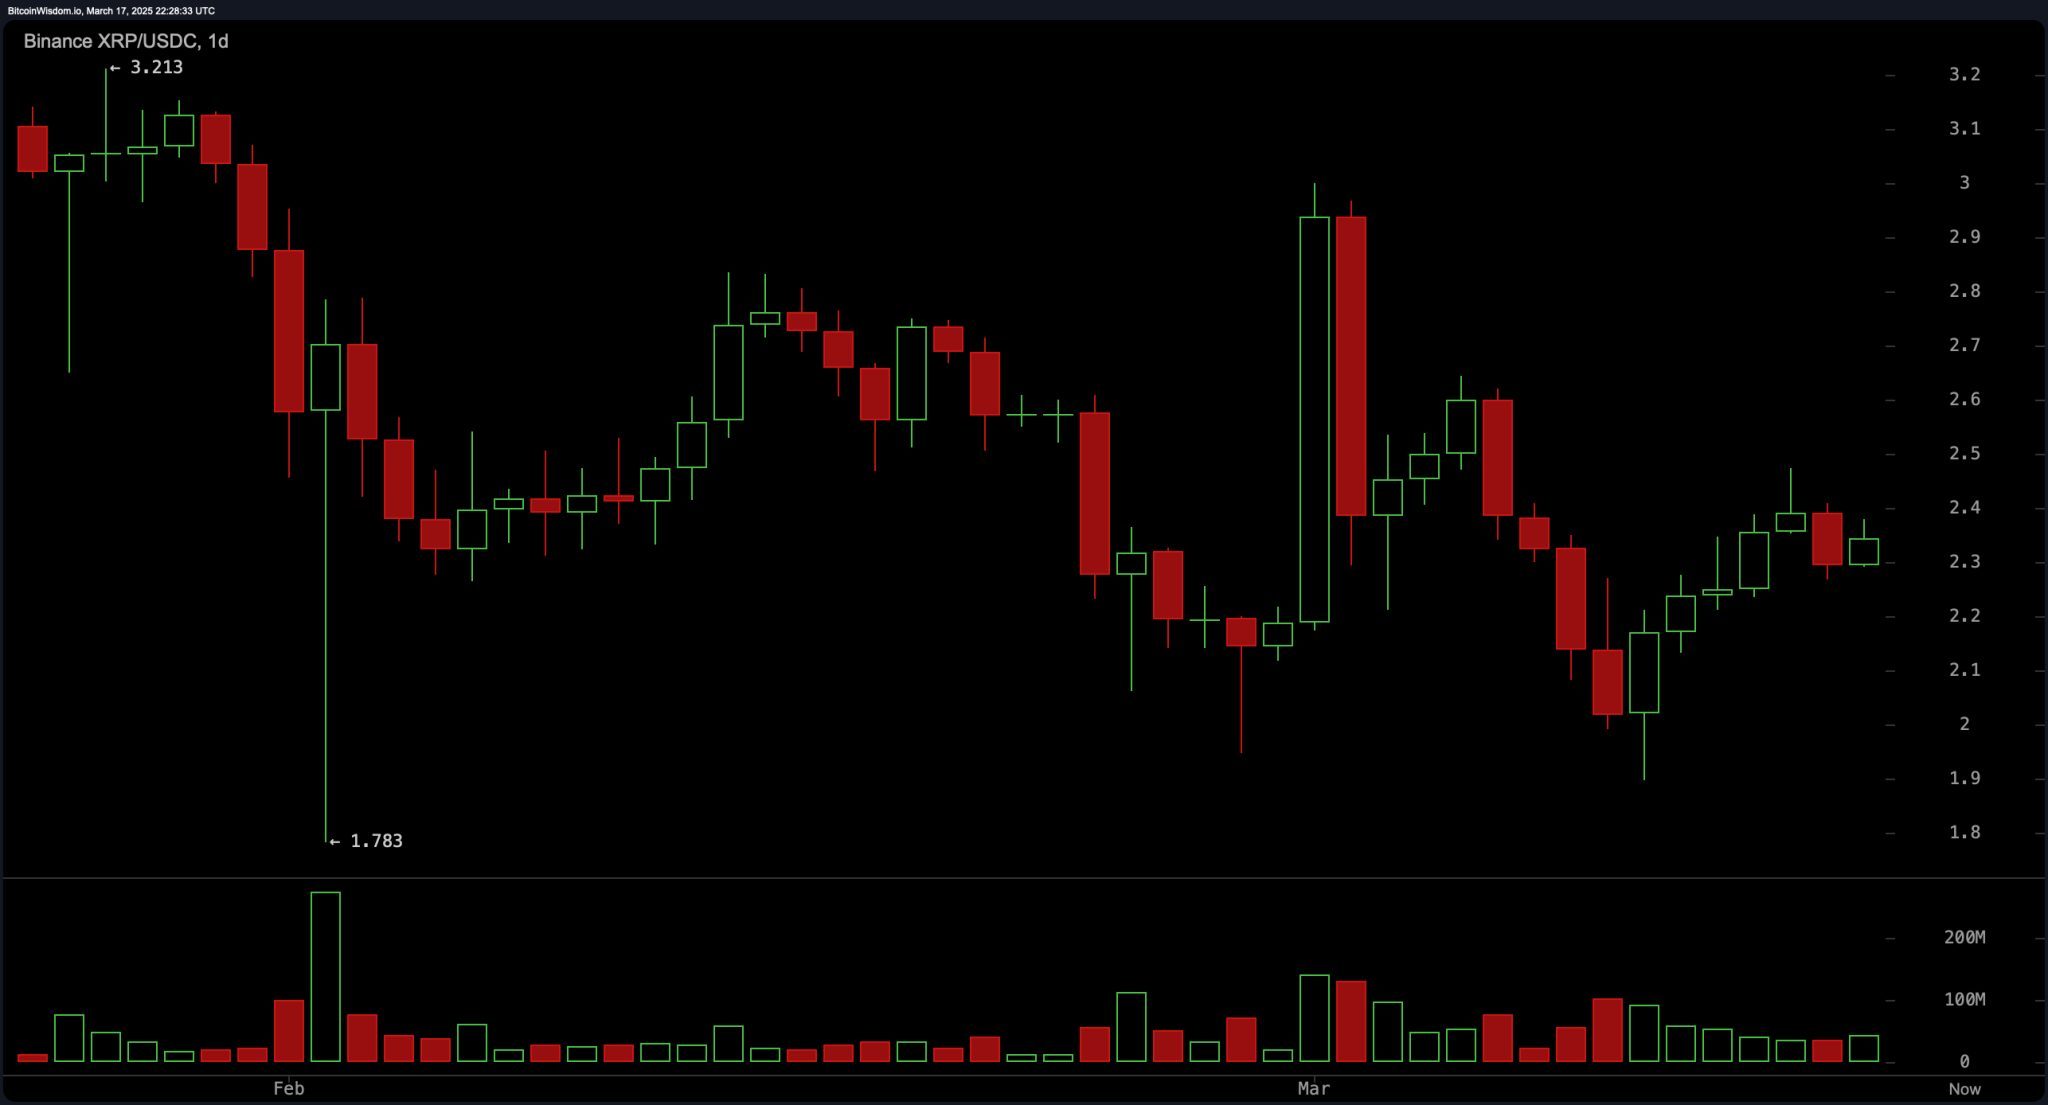
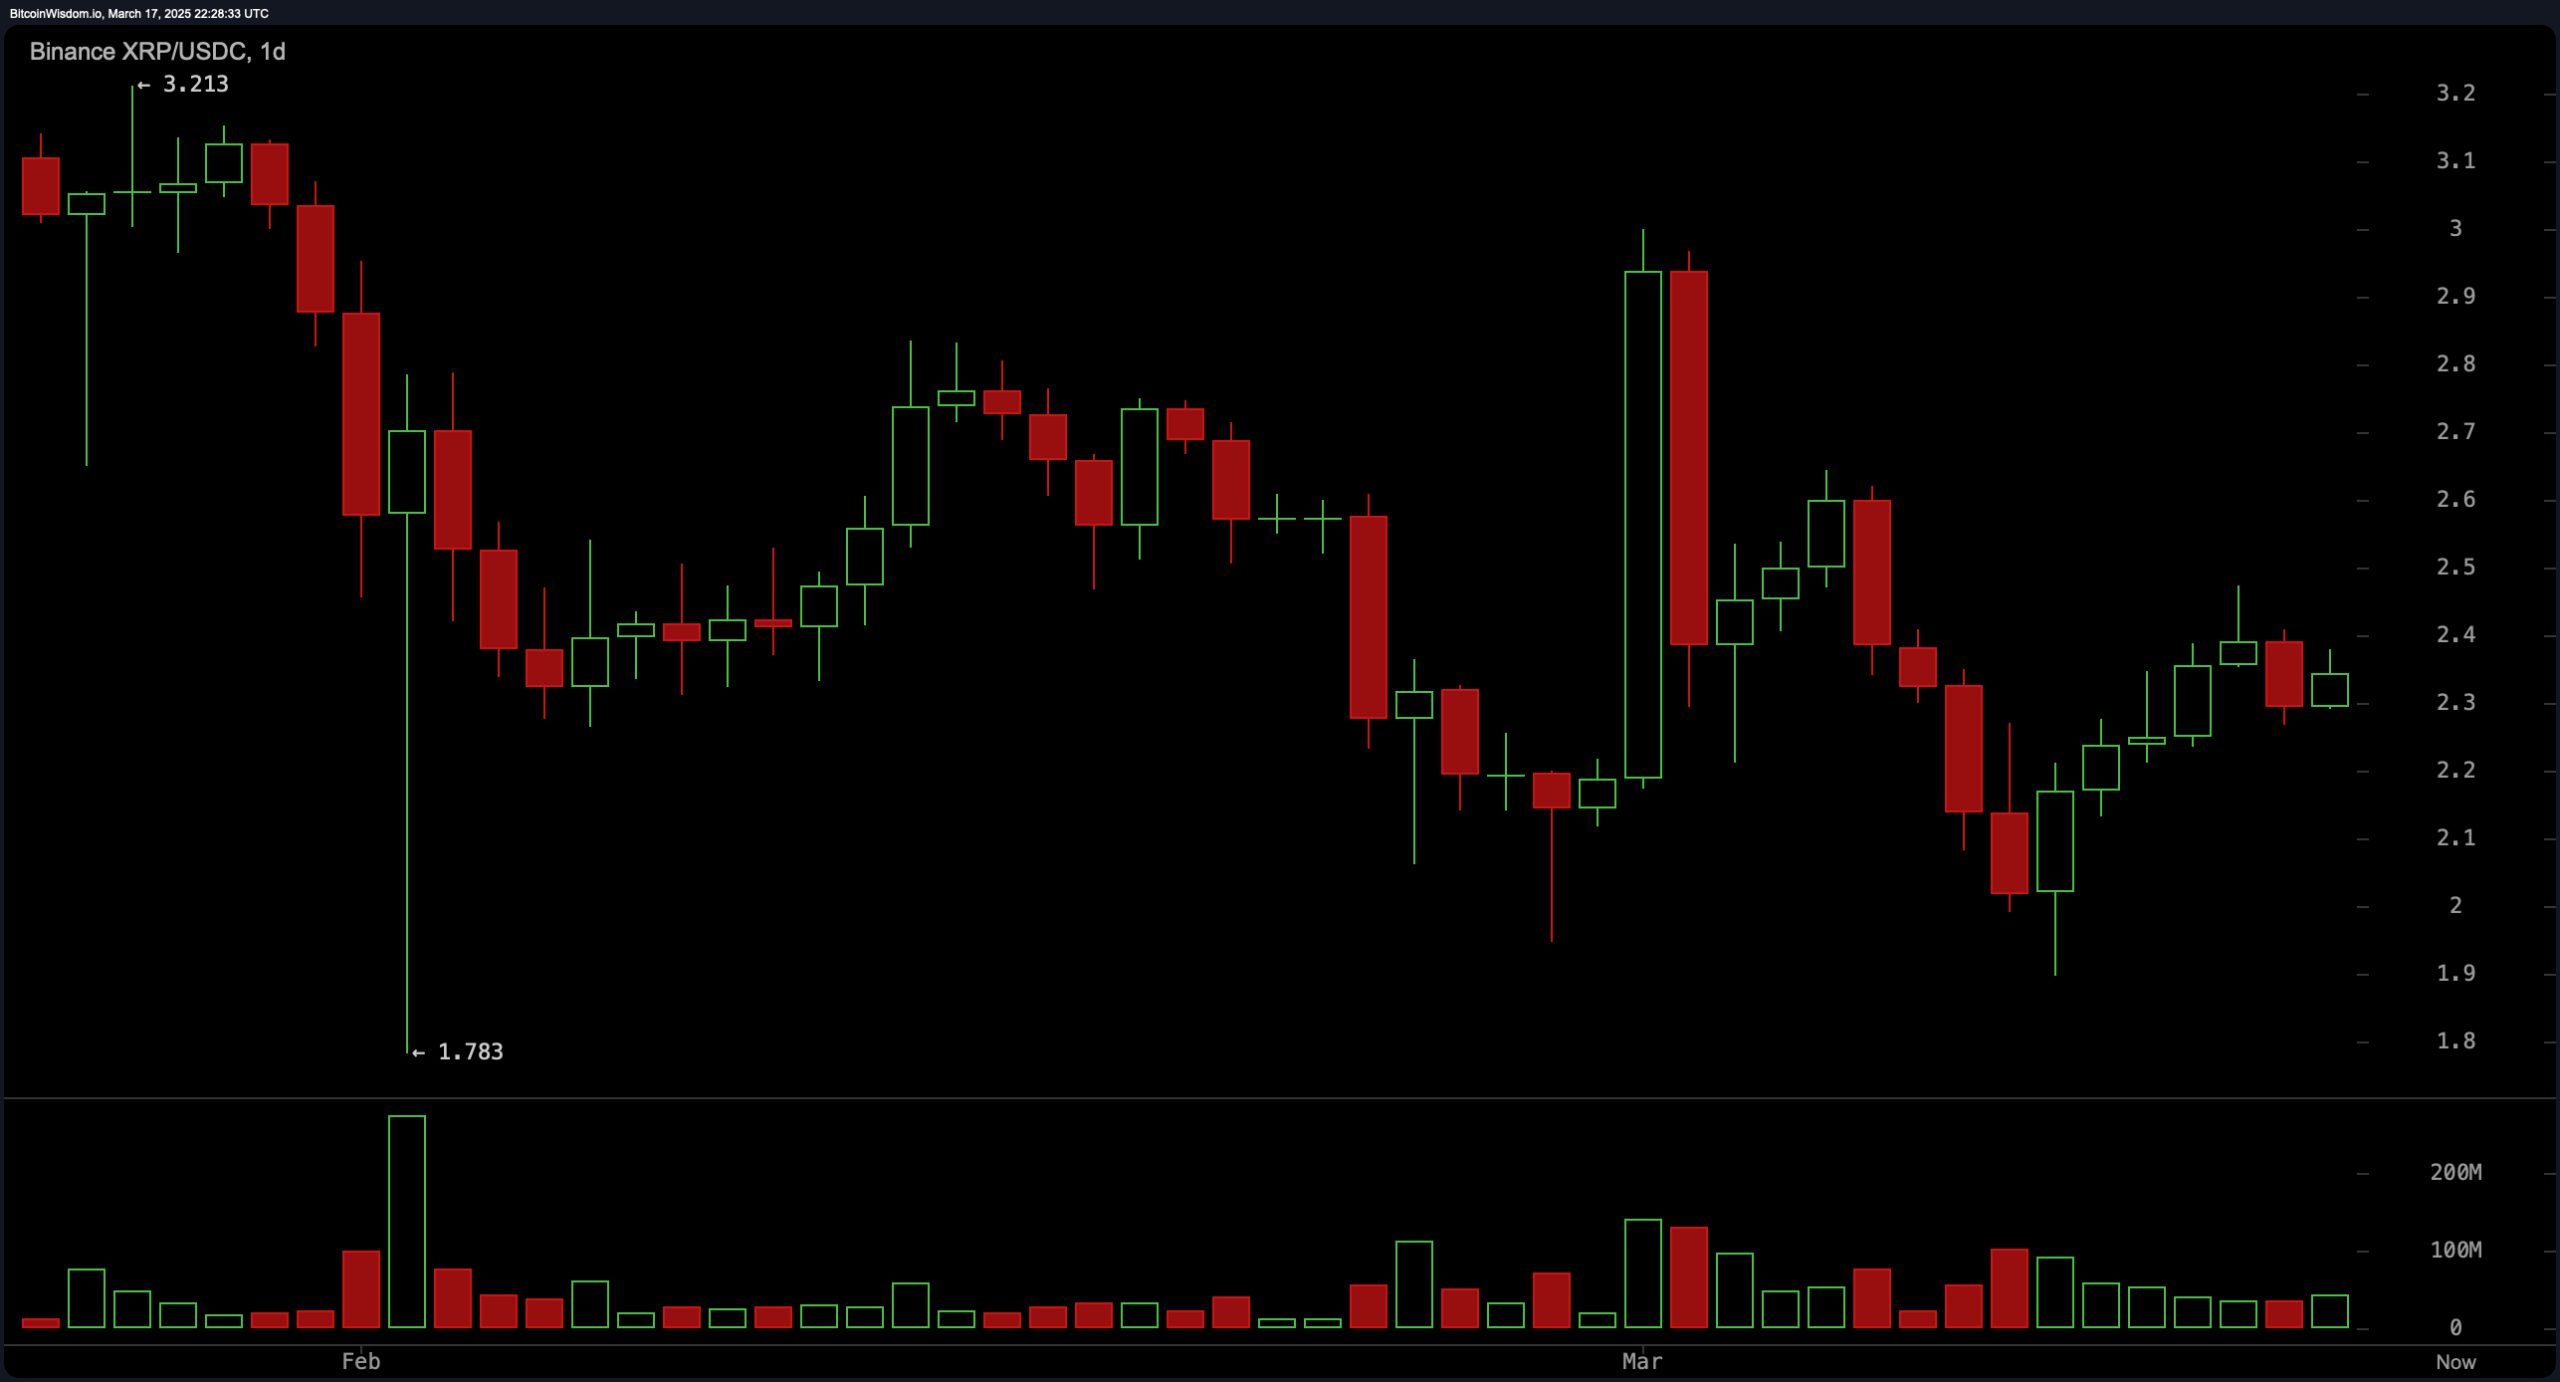
XRP’s daily chart suggests a longer-term downtrend, although early signs of recovery are evident. Resistance at $3.20 remains a significant barrier, while the recent low of $1.78 marks a key support level. Increasing buying volume suggests accumulation, with a bullish scenario unfolding if the price surpasses $2.50–$2.60. Conversely, failing to hold above $2.20 could lead to further declines toward $2.00–$1.80. A confirmed breakout above $2.50 with volume could set the stage for a move toward $3.00.
XRP Price Watch: Is a Breakout Toward $3.00 on the Horizon?
XRP is trading at $2.34 with a market capitalization of $136 billion, as daily trade volume reaches $3.01 billion. The price has fluctuated between $2.29 and $2.38 in the past 24 hours, remaining 31.1% below its all-time high of $3.40. Binance, Coinbase, and Bybit dominate XRP trading, while South Korean markets show a slight premium at $2.38.
XRP
XRP’s one-hour chart signals a slightly bearish trend following a rejection at $2.44. Resistance is observed at $2.38–$2.40, with support forming at $2.27. Bearish volume has increased, hinting at short-term selling pressure. A bullish move requires a breakout above $2.38–$2.40, while a drop below $2.30 could trigger a decline toward $2.25–$2.27.
The four-hour chart reflects a short-term bullish recovery from $1.89 to $2.47, where local resistance has emerged. Buyers have consistently stepped in around $2.10–$2.20, reinforcing support in that region. Volume spikes during the uptrend indicate strong momentum, with a potential push above $2.47 leading to a test of $2.60–$2.70. A decline below $2.30 may suggest a return to the $2.10–$2.20 support zone.

XRP’s daily chart suggests a longer-term downtrend, although early signs of recovery are evident. Resistance at $3.20 remains a significant barrier, while the recent low of $1.78 marks a key support level. Increasing buying volume suggests accumulation, with a bullish scenario unfolding if the price surpasses $2.50–$2.60. Conversely, failing to hold above $2.20 could lead to further declines toward $2.00–$1.80. A confirmed breakout above $2.50 with volume could set the stage for a move toward $3.00.
Oscillators indicate a neutral to mildly bullish sentiment. The relative strength index (RSI) at 48.74 is neutral, while the Stochastic at 46.83 and commodity channel index (CCI) at 7.05 also suggest a lack of strong momentum. The average directional index (ADX) at 19.11 indicates a weak trend, while the awesome oscillator (-0.091) remains neutral. The momentum at -0.041 and moving average convergence divergence (MACD) level at -0.058 both signal positivity, suggesting potential upside pressure.
Moving averages (MAs) present a mixed outlook. The exponential moving average (EMA) and simple moving average (SMA) on the 10-period timeframe both signal bullish indications, while the 20-period EMA suggests selling pressure. The 30, 50, and 100-period SMAs reflect bearish sentiment, while the 100-period EMA signals optimism. The 200-period EMA and SMA reinforce long-term bullish sentiment, with prices holding above key levels.
Fibonacci retracement levels highlight key support and resistance areas. The one-hour chart marks $2.30–$2.38 as crucial resistance, while the four-hour chart suggests $2.32–$2.39 as a strong resistance zone. On the daily chart, the 38.2% retracement level at $2.45 and the 50.0% level at $2.69 act as key levels to watch. If XRP holds above $2.69, further bullish momentum could drive it toward $3.00. A break below $2.16 could indicate a shift toward bearish conditions.
Bull Verdict:
XRP’s technical indicators suggest a potential bullish breakout if it holds above $2.45 and successfully pushes past $2.69. Increasing buying volume and a neutral-to-positive oscillator setup hint at accumulating momentum. A confirmed breakout above $2.50–$2.60 could send XRP toward the psychological $3.00 level, with the long-term outlook improving if it reclaims $3.20.
Bear Verdict:
Despite short-term recovery signs, XRP remains in a broader downtrend, with resistance levels at $2.45 and $2.69 proving difficult to break. The moving averages indicate selling pressure on mid-term timeframes, and a failure to hold above $2.20 could lead to a decline toward $2.00 or lower. If XRP fails to regain momentum, it risks slipping back into bearish territory.