
XRP holds steady at $2.05, with a market capitalization of $119 billion and a 24-hour trading volume of $1.87 billion. Over the past day, it has fluctuated between $2.05 and $2.16, while the weekly range spans from $1.97 to $2.19. As of April 6, 2025, XRP reveals a technically strained formation across several timeframes, mirroring a market mood that is tentatively leaning toward the defensive side.

XRP
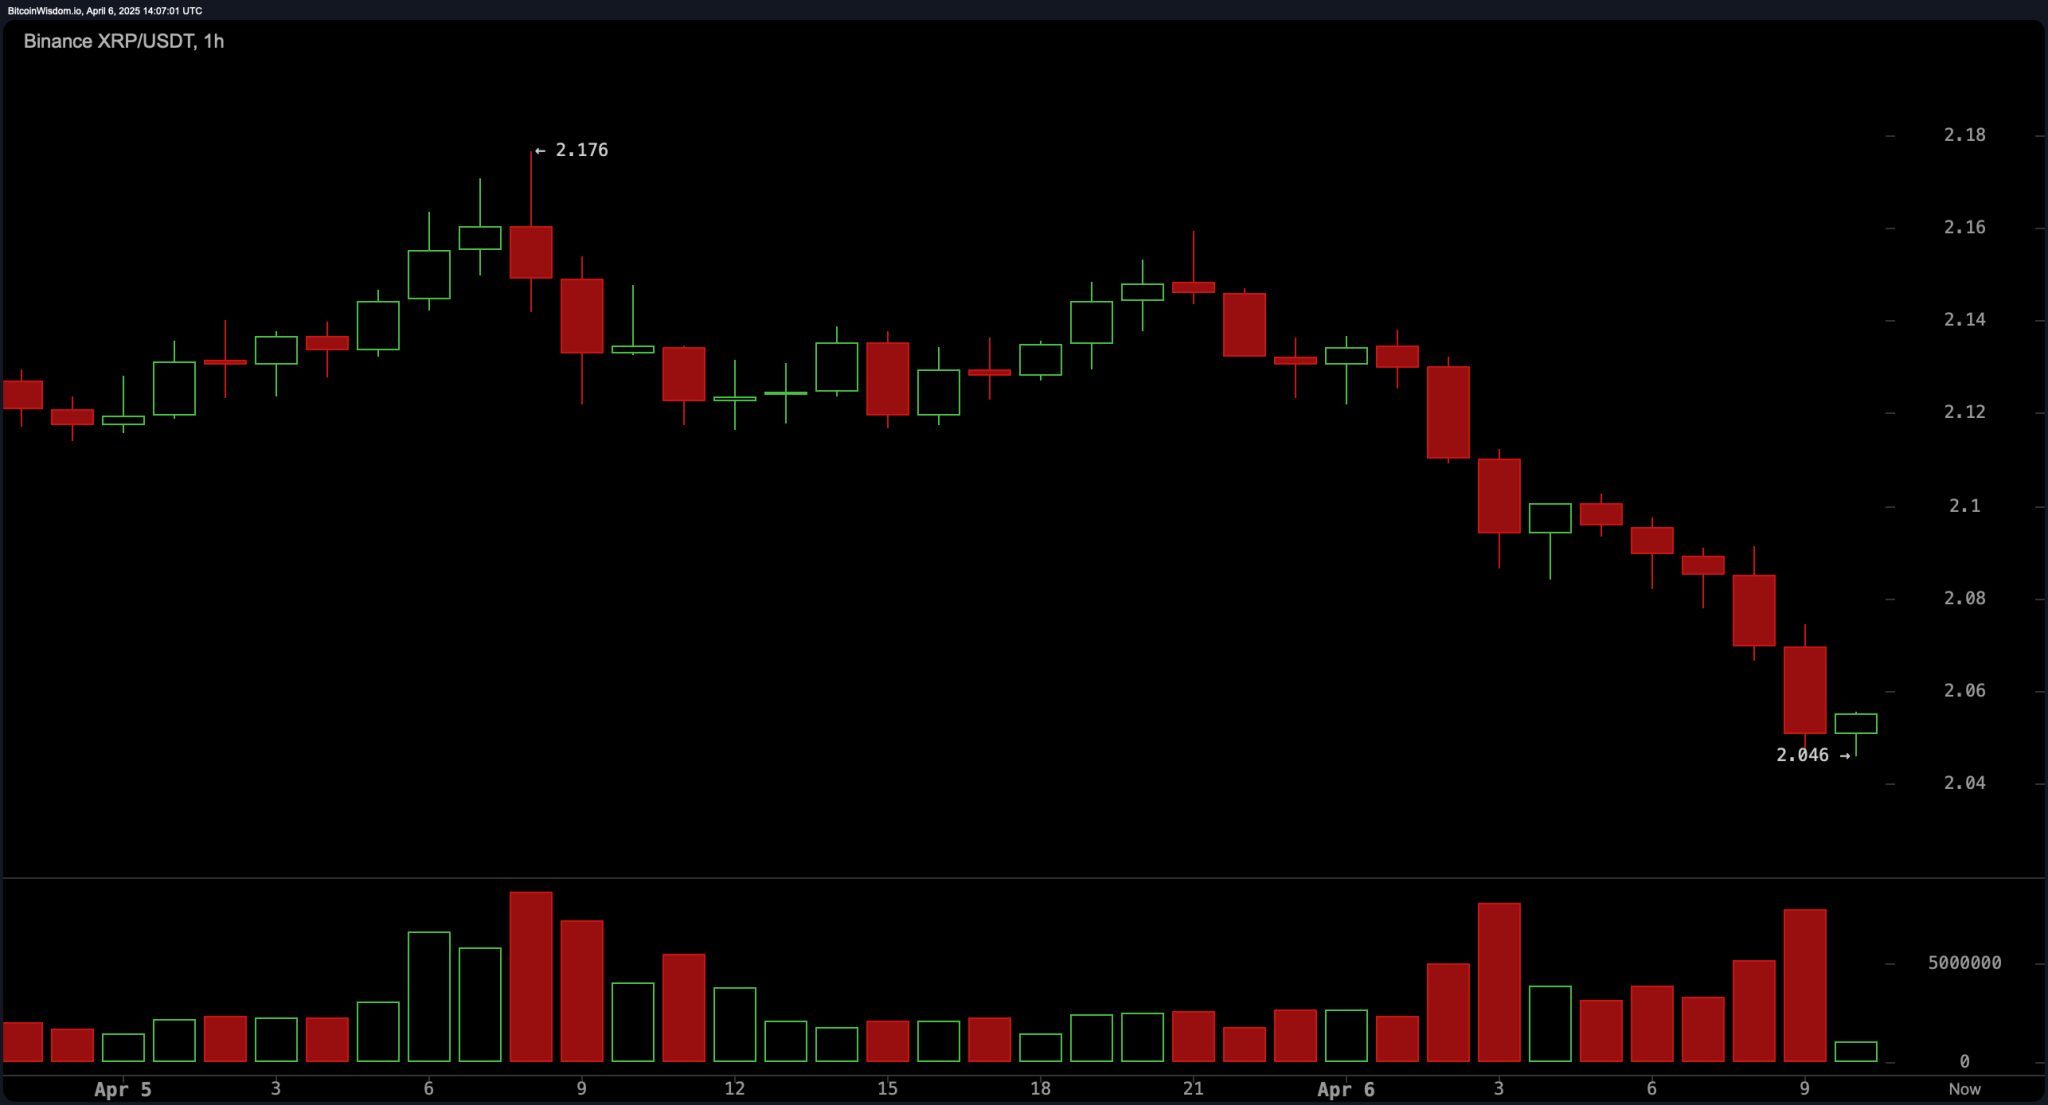
In the 1-hour chart, XRP has shown a defined downtrend from a high of $2.176 down to $2.046, emphasizing near-term weakness. Although there were some minor relief bounces, the rallies were accompanied by low volume, weakening any bullish argument. Notably, red candle volume spikes further confirm sellers’ dominance in this timeframe. With no convincing reversal signals, the sentiment remains bearish, and any counter-trend long positions appear premature, barring clear pattern shifts.
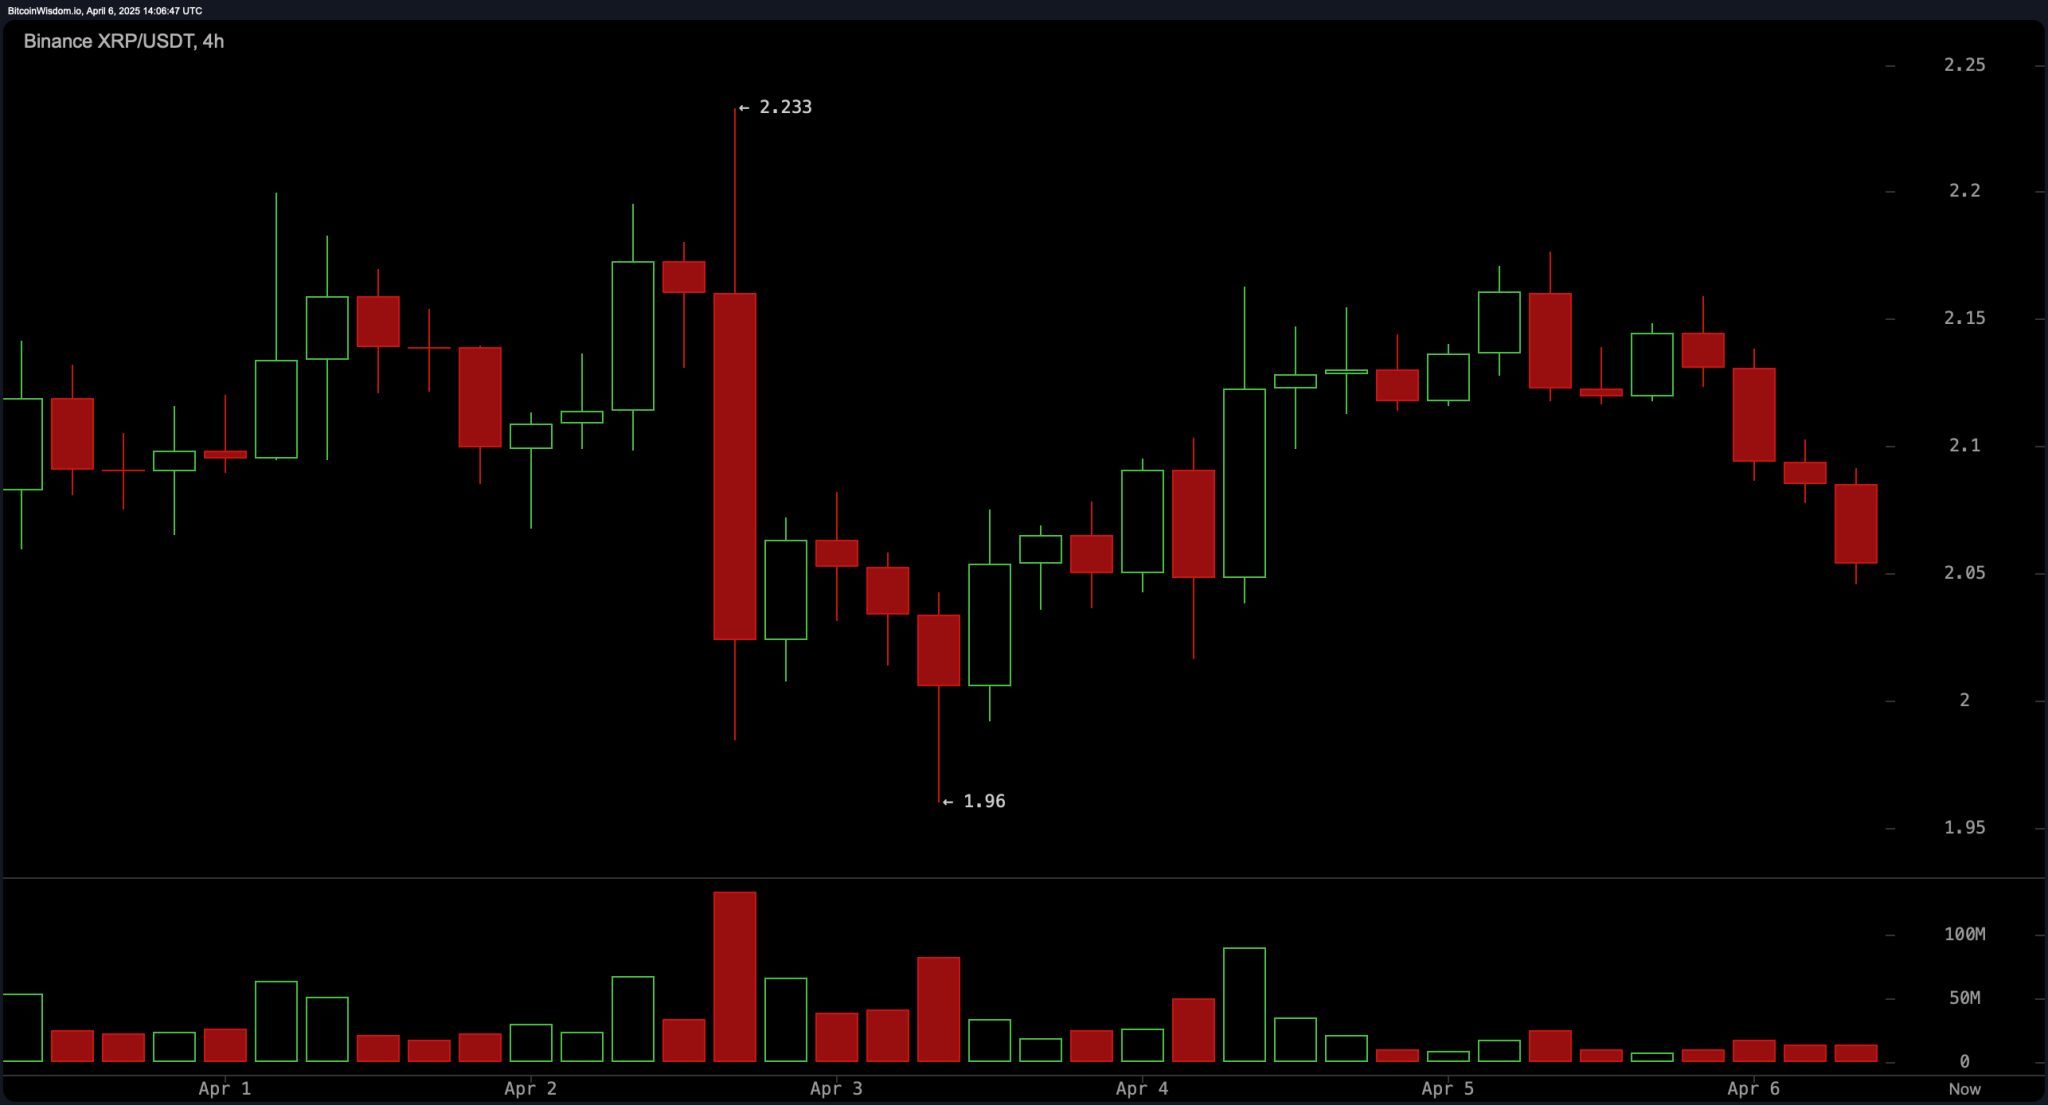
The 4-hour chart reinforces this downward bias. After peaking at $2.233, XRP saw a sharp decline to $1.96 before a modest recovery attempt. However, this bounce lacked momentum, with strong resistance reappearing in the $2.15–$2.18 region. Subsequent movement under $2.10 suggests continued seller pressure, and recent rejections from higher levels point to the formation of a bull trap followed by volume-driven dumps. The short-term structure is thus firmly bearish with tentative support around $2.05–$2.06.
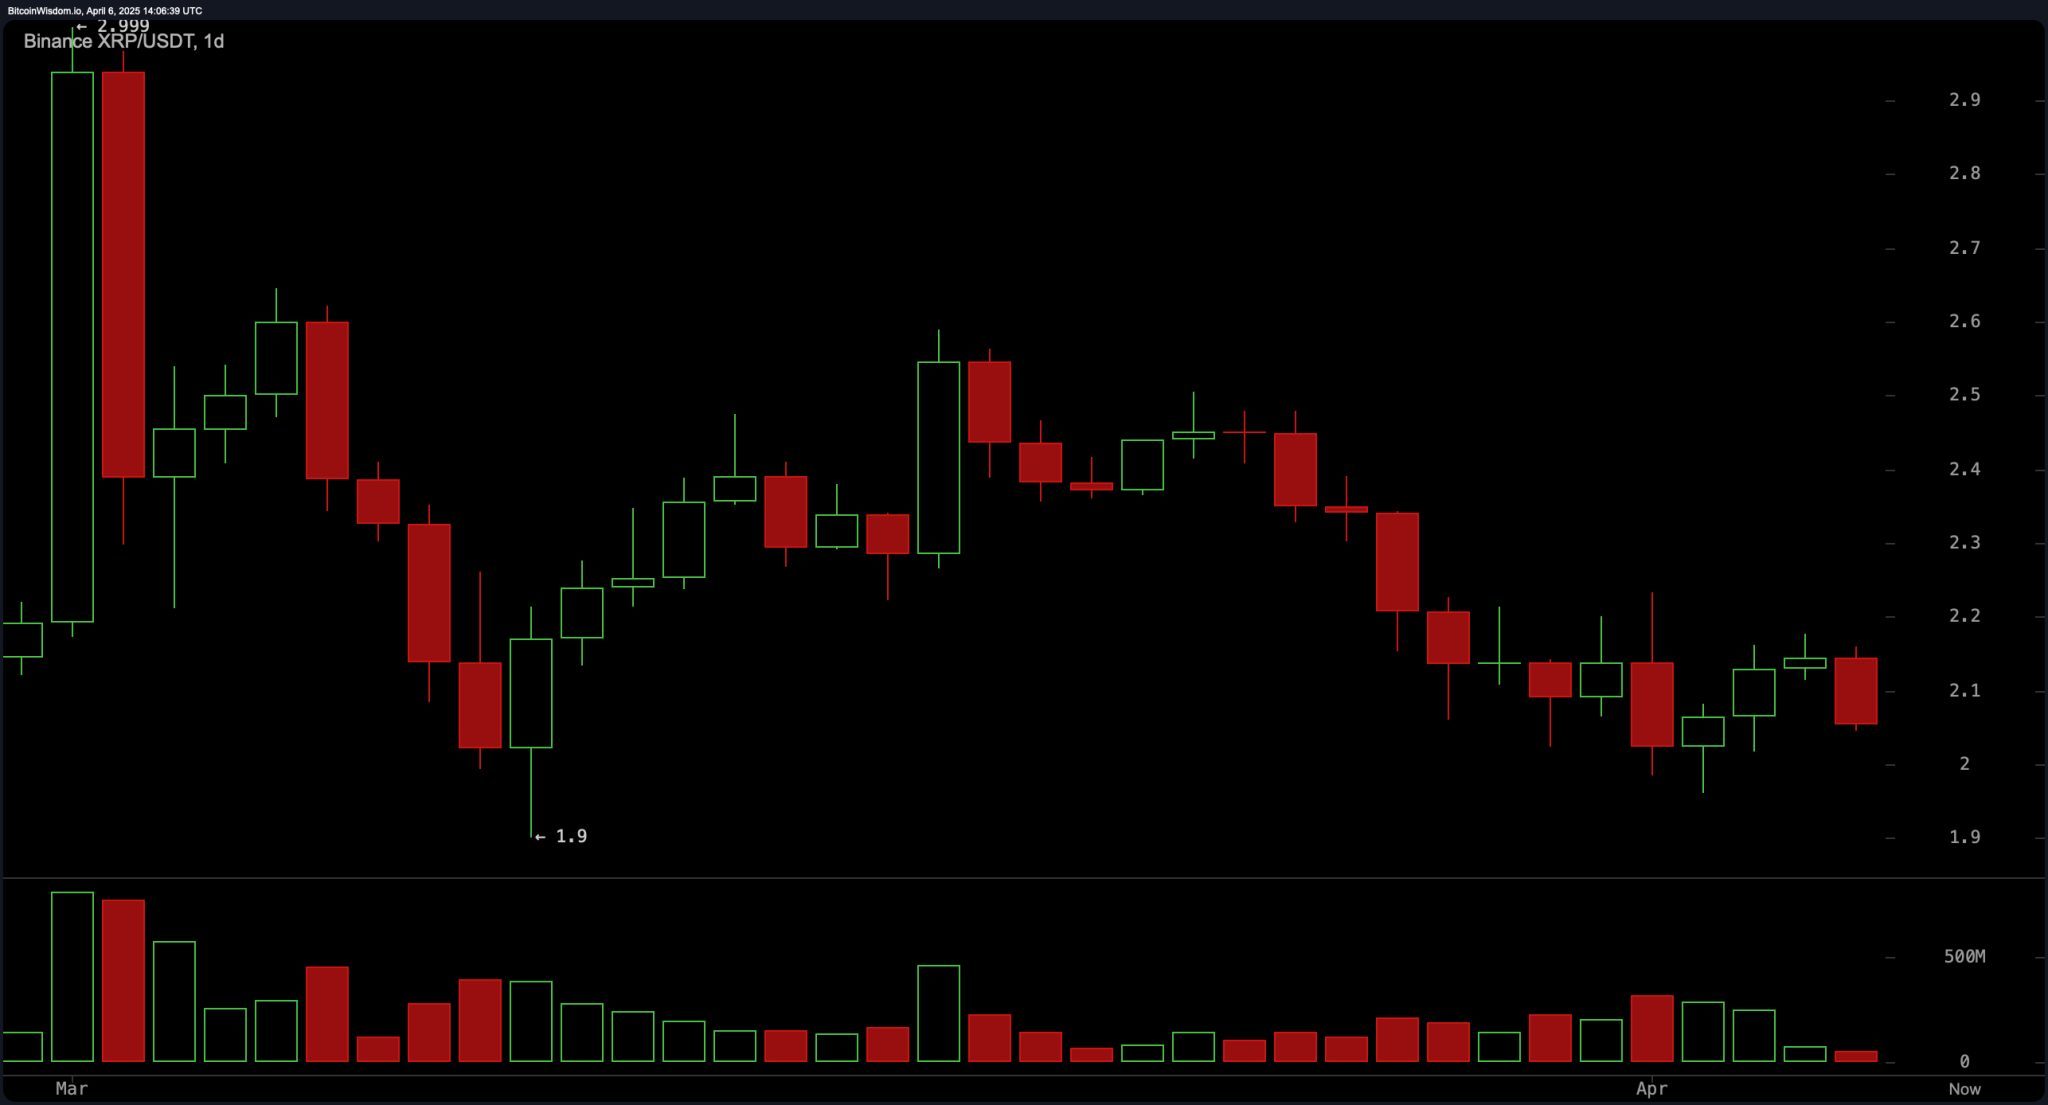
The daily chart signals a potential distribution phase, as lower highs and lower lows take shape after a climb from $1.90 to the $2.5–$2.6 range. Resistance near $2.90 and soft support at the $1.90 mark are the key zones. The tapering volume profile indicates diminishing bullish strength, and the absence of any clear reversal patterns implies the continuation of the current downtrend. XRP is currently hovering between $2.10 and $2.15, without sufficient buying interest to initiate a new rally.
Oscillators are predominantly neutral, though momentum indicators reveal underlying weakness. The relative strength index (RSI) stands at 40.07, the Stochastic at 27.44, the commodity channel index (CCI) at -82.15, the average directional index (ADX) at 17.47, and the awesome oscillator at -0.195, all indicating neutrality. However, the momentum (10) reads at -0.285 and the moving average convergence divergence (MACD) level at -0.083, both signaling a sell. This split in oscillator behavior suggests traders are watching for confirmation of further decline or a potential reversal setup.
Fibonacci retracement levels offer additional context for potential price reactions. In the 1-hour chart, key levels include the 38.2% retracement at $2.126 and the 61.8% at $2.096, highlighting resistance zones. The 4-hour timeframe shows 38.2% at $2.129 and 61.8% at $2.064, while the daily levels place 38.2% at $2.518 and 61.8% at $2.282. These zones are crucial in determining whether XRP finds support or continues to breach through retracement thresholds, particularly if it falls below the 50.0% levels across timeframes.
Moving averages show clear alignment with the bearish outlook. The 10-period exponential moving average (EMA) is $2.13781, and the 10-period simple moving average (SMA) is $2.11141, both issuing a bearish signal. Similarly, all short- and mid-term averages—20, 30, 50, and 100—are also below current price levels and marked as negative signals. Only the 200-period EMA and SMA, at $1.95048 and $1.84017, respectively, register as bullish signals, suggesting long-term support may eventually come into play. Until then, trend followers will likely adhere to the broader bearish momentum across all major indicators.
Bull Verdict:
If XRP can hold above the critical support near $2.05 and reclaim the $2.10–$2.15 zone with strong volume, it may attempt a breakout toward the $2.18–$2.20 range. A close above this resistance, supported by a shift in oscillator momentum and price moving above key short-term moving averages, could signal a bullish reversal and re-engagement with higher Fibonacci retracement levels near $2.28 and $2.40.
Bear Verdict:
The prevailing trend remains bearish across all major timeframes, with price action consistently making lower highs and struggling to maintain support above $2.10. Unless bullish volume returns and key moving averages flip to support, XRP risks falling below immediate support zones, potentially revisiting $1.95 or lower. The convergence of sell signals from momentum indicators and moving averages supports the continuation of this downtrend.