
By Olivia Brooke - March 10, 2021

Historically bullish patterns have been trailing the Bitcoin market scene, signaling a potential price pump to a new all-time high. Like many other indicators, a bullish pattern has once again been spotted. This time, the estimated price unseats all previous predictions, as Bitcoin could be headed for a breakout above $300,000.
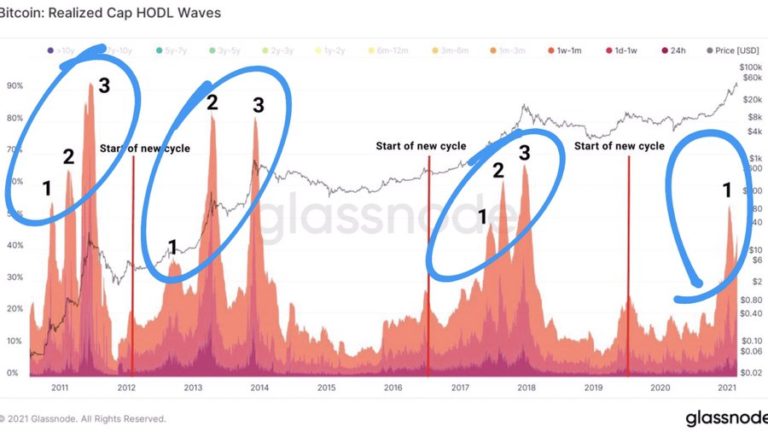
According to the historical pattern spotted, Glassnode revealed a chart that shows a significant trend pattern that comes with every bull market; three bullish waves. Usually, the first wave takes the asset from its base price to a higher level.
Two other levels precede the first, with the last being higher than the second. This was captured in three bullish market cycles, where prices surged significantly at the end of the last wave. While the second and third waves have historically been slightly different in price, both waves are significantly higher than the first.
For Bitcoin, imitating this pattern could birth the most bullish Bitcoin market ever seen. Moreover, Bitcoin’s first wave (the only wave it has completed) is extremely bullish for the asset, when these historical patterns are considered.
With how fast Bitcoin surged in the first wave, there’s no telling where prices will be when the second and third wave hit, although the estimated price mark if Bitcoin follows historical patterns and surges by 7.5%, is $315,000.

Via Glassnode (Click image for larger view)
While historical patterns are useful hints, it’s important to remember that the market dynamics from Bitcoin’s first bull run to date have evolved. In 2017’s bull run, institutions were skeptical about the asset and left the job of accumulation to retail traders who propelled prices above $19,000.
The stagnation in Bitcoin price from then till 2020 when that price mark was broken, served as a key transition period. At present, the tables have been turned and institutional players are accumulating in large numbers. Hence, previous historical trends can lose importance as the market takes a different route.

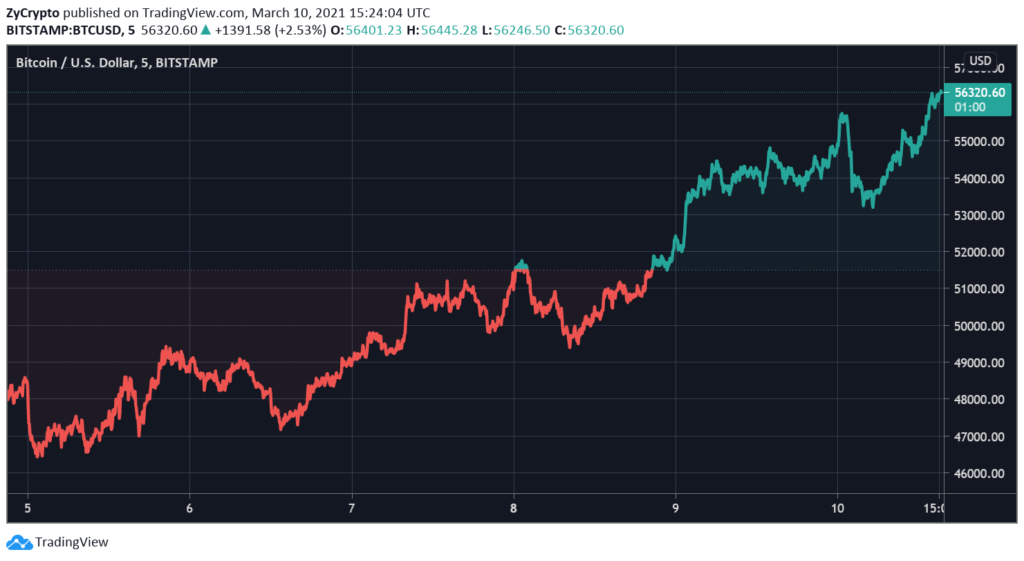
BTCUSD Chart By TradingView (Click image for larger view)
As one Bitcoin observer puts it :
“History is just history. I suspect we will see similarities but the power of a large institution can render btc history obsolete. So..”
At present, a recurring pattern particular to institutional activities is the constant FUD leveraged by Bitcoin whales to accumulate even more Bitcoin, by bidding for best prices and getting sellers to cave.
This has resulted in an occasionally bearish market as sellers continue to fall prey to these whales. Analysts have asserted that once the retail trading eases, Bitcoin is set to make a major comeback.
DISCLAIMER
The views expressed in the article are wholly those of the author and do not represent those of, nor should they be attributed to, ZyCrypto. This article is not meant to give financial advice. Please carry out your own research before investing in any of the various cryptocurrencies available.
The original article written by Olivia Brooke and posted on ZyCrypto.com.
Article reposted on Markethive by Jeffrey Sloe
