x


By Aayush Jindal - February 28, 2021 in BTC Reading Time: 2min read

Bitcoin price started a fresh decline after it failed to clear $52,000 against the US Dollar. BTC is sliding and it remains at a risk of a drop towards $41,000.
This past week, bitcoin price extended its decline below the $47,000 support zone against the US Dollar. The BTC/USD pair even tested the $44,000 support zone and settled well below the 100 simple moving average (4-hours).
The last rejection zone was near the $52,000 level before the price declined below $45,000. It traded as low $44,360 before correcting higher. It recovered above the 23.6% Fib retracement level of the downward move from the $52,229 high to $44,360 low.
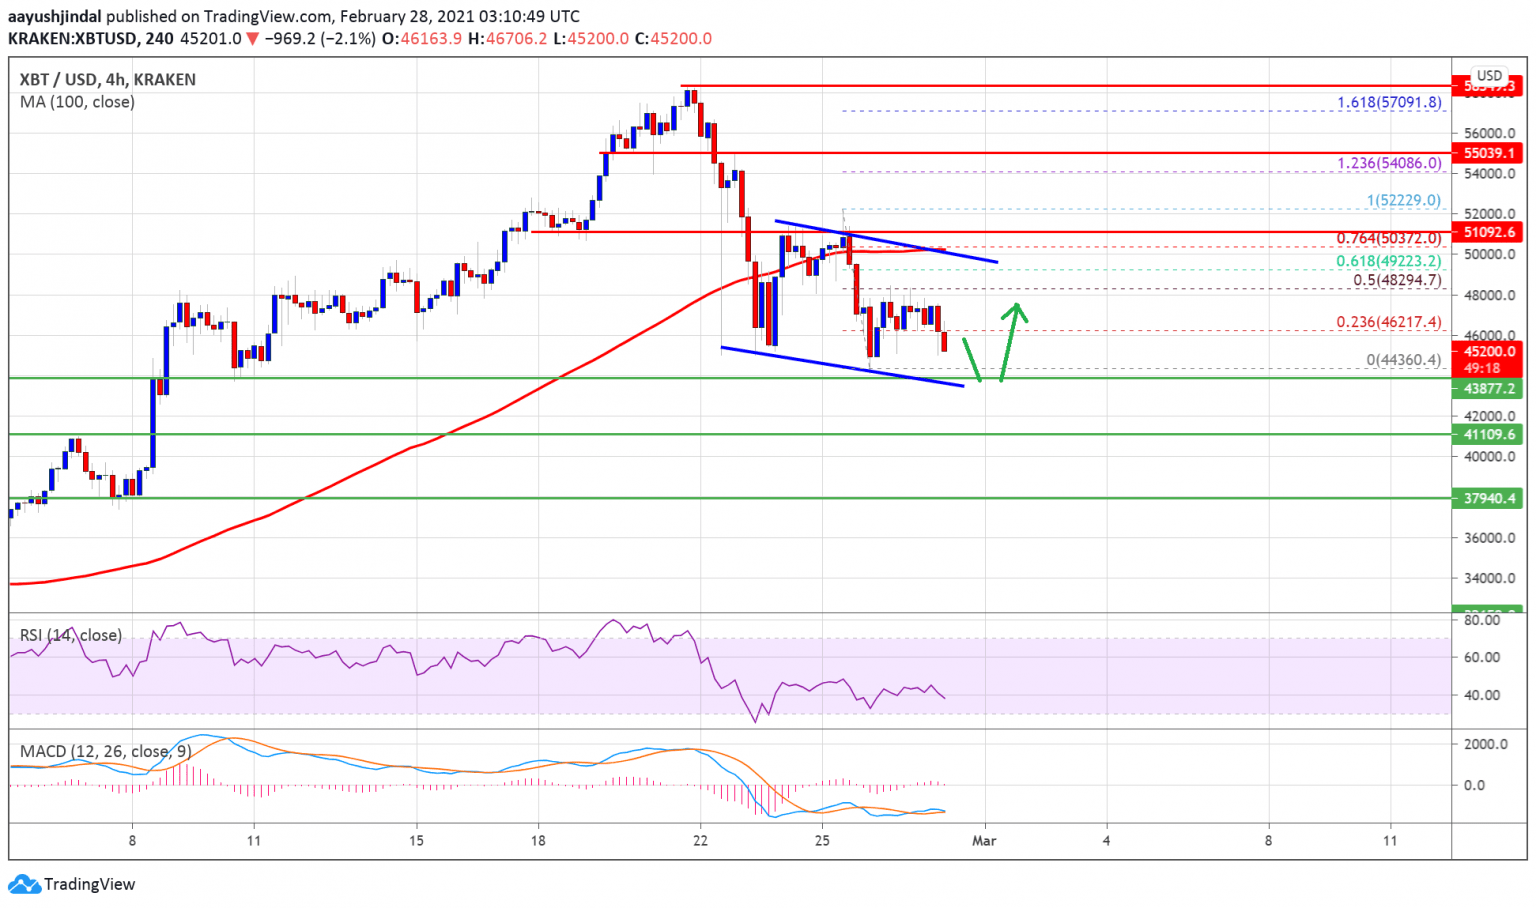
(Click image for larger view)
Source: BTCUSD on TradingView.com
However, the price struggled to clear the $48,000 resistance zone. It also failed to surpass the 50% Fib retracement level of the downward move from the $52,229 high to $44,360 low.
There is also a key declining channel forming with resistance near $49,220 on the 4-hours chart of the BTC/USD pair. Bitcoin is currently moving lower and it is likely to test the $44,000 support zone. If there is a downside break below the $44,000 support zone, there are chances of more downsides towards the $41,000 support zone. The next major support is near the $40,000 level.
If bitcoin starts a fresh increase, the first key resistance is near the $48,000 level. The main resistance is now forming near the channel upper trend line and $50,000.
A clear break above the channel resistance could open the doors for decent increase above $50,000. The next key resistance is near the $52,000 level, above which the price might rise towards the $55,000 level.
Technical indicators
4 hours MACD – The MACD for BTC/USD is showing negative signs in the bearish zone.
4 hours RSI (Relative Strength Index) – The RSI for BTC/USD is now well below the 50 level.
Major Support Level – $44,000
Major Resistance Level – $50,000

Advertisement
The original article was written by Aayush Jindal and posted on NewsBTC.com.
Article reposted on Markethive by Jeffrey Sloe