x




Gold has long been revered as the ultimate safe-haven asset, protecting wealth during times of monetary uncertainty, inflation, and geopolitical turmoil. Yet even the most seasoned precious metals investors can feel a spike of anxiety when gold prices start swinging wildly.
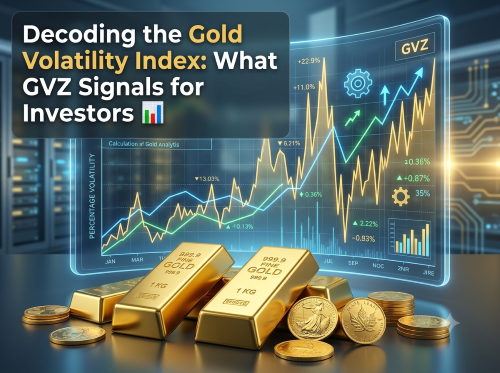
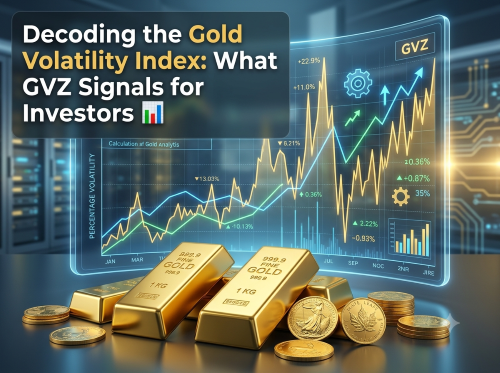
To make sense of these price swings, institutional traders turn to a specific sentiment metric: the Gold Volatility Index, better known by its ticker symbol, GVZ.
Understanding how the GVZ works—and why a rising reading isn't necessarily a warning sign—can give you a distinct advantage when managing your portfolio.
Launched by Cboe Global Markets in June 2008, the Gold Volatility Index measures the market’s expectation of 30-day price fluctuations in gold.
Rather than tracking physical gold directly, the calculation is derived from real-time options pricing on the SPDR Gold Shares ETF (GLD)—one of the world's largest physically backed gold exchange-traded funds.
Because options prices rise when market participants anticipate larger price moves, higher option premiums push the GVZ reading upward. The index expresses this expected movement as an annualised percentage:
Crucially, the GVZ measures the magnitude of expected movement, not its direction. It cannot tell you whether gold is about to skyrocket or plunge; it simply tells you how turbulent the ride is likely to be.
Most financial media outlets regularly report on the Cboe Volatility Index (VIX), often called Wall Street’s "fear gauge." The VIX measures expected 30-day volatility for the S&P 500 equity index. While the GVZ relies on the exact same mathematical formula as the VIX, its underlying market dynamics are fundamentally different.
The VIX is almost purely an equity fear indicator. When stock markets tumble, panic buying of protective put options drives the VIX skyward. Conversely, when stock markets rise steadily, the VIX typically drifts lower.
The GVZ behaves differently because gold itself fulfils a unique role in global finance. Demand for gold surges during monetary crises, falling real interest rates, and geopolitical shocks. Consequently, the GVZ can spike during panic sell-offs, but it can just as easily surge during explosive gold bull runs.
By analysing historical data provided by the Federal Reserve Bank of St. Louis (FRED), we can categorise the GVZ into distinct market regimes:
One of the most counterintuitive aspects of the GVZ is that it often surges alongside record-breaking gold prices. For example, during early 2026, as gold hit new all-time highs above $5,589 per ounce, the GVZ climbed past 46.
Why would a "fear gauge" jump when gold is performing so exceptionally well?
The answer lies in institutional behaviour:
The Power of Upside Demand: In a crisis, high volatility is driven by nervous investors buying put options to protect against a crash. But during an aggressive gold rally, high volatility is driven by institutional managers buying call options. Fearing they might miss out on further gains, large funds aggressively buy call options to maintain upside exposure, driving option prices—and therefore the GVZ—sharply higher.
Whether market participants are panicking about a downturn or scrambling to catch a historic rally, both scenarios increase options demand and raise the GVZ. Context is key to interpreting what the index actually means at any given moment.
If you hold allocated physical gold coins or bullion bars in secure storage, daily paper market fluctuations shouldn't keep you awake at night.
The GVZ is derived entirely from short-term paper options traded on an ETF. These contracts expire, and many participants are merely hedging short-term equity exposure or speculating on momentum. None of that trading activity changes the physical purity, weight, or long-term purchasing power of gold bullion held outside the banking system.
However, the GVZ can still offer practical value for active investors looking to add to their holdings:
The Gold Volatility Index is a valuable barometer for gauging market expectations and paper-market sentiment. A high reading isn't a signal to panic or sell your physical holdings—it simply indicates that the market expects significant price action ahead.
By looking beyond the headline figures and understanding the underlying drivers, you can use the GVZ as a useful tool in your broader precious metals strategy.
For more detailed insights, historical data breakdowns, and industry news, you can read the original article on GoldSilver.com:
👉 What Is the Gold Volatility Index (GVZ) — and What Does It Mean for You?
Disclaimer: This article is provided for informational purposes only, mistakes may be made, and it's not offered or intended to be used as legal, tax, investment, financial, or any other advice.