x




On a few occasions last year, crypto advocates discussed how a number of price models, leveraged to help predict the future value of bitcoin, ended up failing. However, since bitcoin’s value has increased by 36% over the last month, the price has entered the darkest band of the rainbow chart after breaking below the rainbow chart’s lowest band at the end of 2022.
Last year, specifically in Aug. 2022 and then at the end of the year, the cryptocurrency community discussed the various charts and price models people used to predict where bitcoin’s price was headed next. Over the last decade, a number of the models have followed bitcoin’s specific price patterns pretty closely. People would often leverage charts and models like the rainbow indicator, the golden ratio multiplier, the Fibonacci sequence, logarithmic growth curves, and Plan B’s stock-to-flow (S2F) price model.
As the community felt the grip of the crypto winter and the price models failed to forecast bitcoin’s price bottom, people started to dismiss the bitcoin price models and mock indicators like the rainbow chart. But this week, people have noticed that bitcoin’s price on the rainbow model has entered the lowest and darkest band. The rainbow chart is located on a number of bitcoin-focused websites that showcase charts and data, including blockchaincenter.net and lookintobitcoin.com.
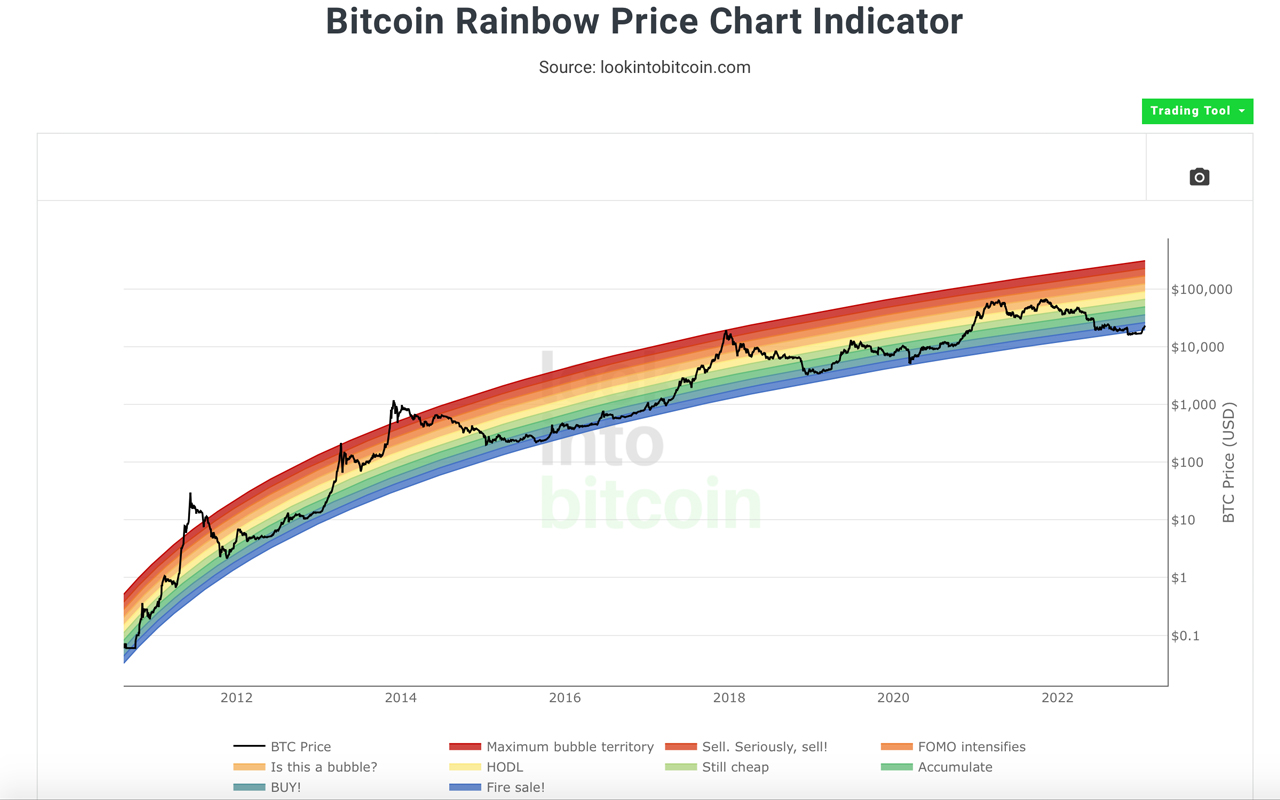
The blockchaincenter.net chart shows that bitcoin’s price has not broken the darkest and lowest band in the rainbow, but the lookintobitcoin.com chart shows a break. Lookintobitcoin.com summarizes how the rainbow chart, or colored bands, are overlaid over BTC’s logarithmic growth curve channel. It can signal when to buy and when to sell, but the website stresses “there is no guarantee that past performance fit within the rainbow channel will continue to play out in the future.”
Crypto Twitter has been discussing bitcoin’s grand entrance back into the rainbow. “Rainbow Price Chart Reintegration,” Titan of Crypto tweeted. “After a drop below the ‘fire sale!’ blue band, [bitcoin] managed to get back into the rainbow. Did you dare scooping up some [bitcoin] when it was below?” the individual asked. “[Bitcoin’s] Rainbow Chart is predicting the future … It has shown through the history of bitcoin when to buy and sell. You have to study this thing to really get comfortable with the long-term price of bitcoin,” another fan of the rainbow chart wrote.
The rainbow chart redemption is making the rounds on social media, and some have suggested the entry is a bullish signal, while others have been skeptical. While the indicator shows BTC’s price has been on the rise, a correction could very well be in the cards. Furthermore, while the rainbow chart is in good standing, the logarithmic growth curve chart is way off the map, by a long shot.