
x
Black Bar Banner 1
x

New: AI Blog Autopilot — free for the next 30 days. Switch it on by November 15th »

NEW: Smart Mail is live — free for every member. Send broadcasts, build lists and run autoresponders. Open Smart Mail »

Training: Lesson 14 in Getting Started with MarketHive. Watch it now »

A+ A−
Ads by Markethive - View All
The Blog Feed
The Blog Feed
» Blog Feed
Write a New Blog Post
Search Blog Status
Most Viewed
Most Recent
Most Shared
Alphabetical
Markethive Blog (default)
My Blog Posts
Friends' Blogs
Blog Categories
All
Advertising
Blockchain & Cryptocurrency
Business Development
Diet & Weight Loss
Environmental
Health and Wellness
History and Culture
Home and Garden
Marketing
Mentoring & Training
Money & Finance
Other
Political
Prayer & Religion
Programming & Technical
Real Estate
Search Engine Optimization
Social Media
Spirituality
Sports & Recreation
Transport
Travel & Events
Website Design
Blogging Tools & Assets
My Blog Info
Members Subscribed to You
Blogs You Are Subscribed To
Website Widget
Wordpress Plugin
Subscribe for Greater Services
Subscribe to one of many subscriptions, each one includes the previous ones.. Unlock powerful tools, advance features, to build a powerful reach.

What trend-line analysis suggests gold prices will be on Jan. 1 - brace yourself

Posted by David Ogden on June 25, 2020 - 5:03am


What trend-line analysis suggests gold prices will be on Jan. 1 - brace yourself

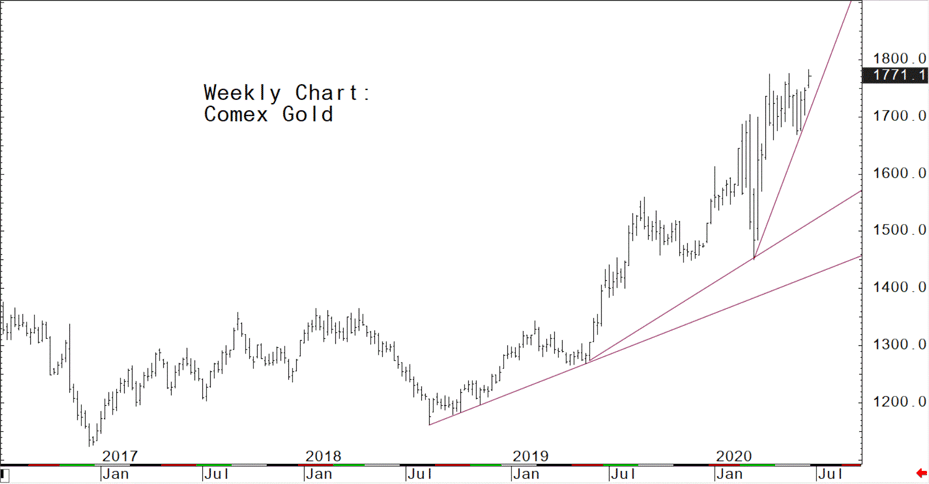
I don't like to beat around the bush and I'll bet you don't either. So, let's make this quick. Nearby Comex gold futures hit a 7.5-year high of $1,783.10 Wednesday. The August futures contract hit a high of $1,796.10. The all-time high in nearby gold futures was $1,920.70, hit in September of 2011.

Take a gander at the weekly continuation chart for nearby Comex gold futures. Prices are in an accelerating uptrend as seen by the three trend lines that get progressively steeper. Trend-line analysis, using the latest, steepest trend line, projects the following prices in the following timeframes: Sept. 1--$1,886; Nov. 1--$2,040; Jan. 1--$2,213.

Of course, technical chart analysis is an imperfect art. However, most of the “smart money” in the marketplace will attest that studying technical price charts provides more trading success than solely examining supply and demand fundamentals in a market.
Jim Wyckoff


tatana Tatiana Yarushina thanks for sharing
July 2, 2020 at 2:01pm
Simon Keighley Gold has always been the safe-haven in uncertain times & market turmoil David - These weekly trend lines highlight Gold's bullish run. Thanks for sharing.
June 25, 2020 at 10:11am
M H Thanks for this info, David
June 25, 2020 at 6:11am
Tim Moseley Skyrocketing gold prices = decline in the purchasing power of the US dollar. Could be great for crypto too!!
June 25, 2020 at 5:33am